
To open long positions on EURUSD you need:
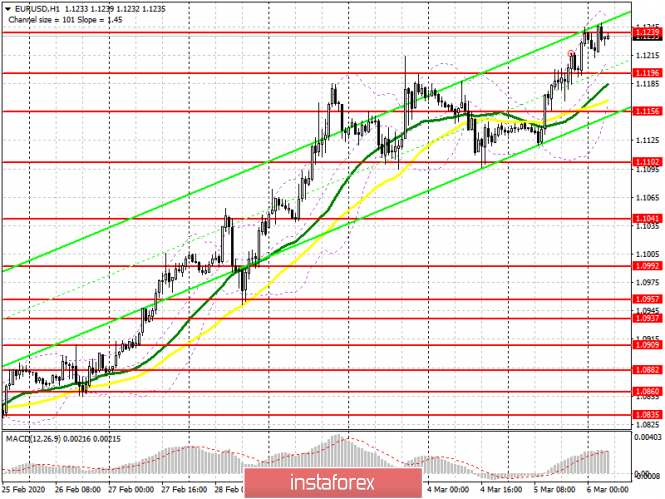
Yesterday's reports on the decline in production orders and changes in the level of labor costs in the US in the afternoon put pressure on the dollar, which led to a breakdown of important resistance in the pair and the continuation of the upward trend. At the moment, the bulls are focused on resistance 1.1239, which I talked about in yesterday's review, as it was not possible to break above this level the first time. Only a breakthrough in this area will resume demand for the euro and lead to an update of the highs of 1.1279 and 1.1311, where I recommend taking profits. However, more rational purchases will be after a downward correction to the 1.1196 area, subject to the formation of a false breakout, or to a rebound from a low of 1.1156.
To open short positions on EURUSD you need:
No important fundamental data was published in the morning, so it seems that large sellers will be waiting for a report on the US labor market, which is scheduled for release in the afternoon. You should not rush into selling during the European session. The formation of a false breakout in the region of 1.1239 will be a signal to open short positions. But I recommend postponing larger sales to the test highs 1.1279 and 1.1311. An equally important task for sellers will be to return the pair to the support level of 1.1196, since consolidating below this range will push the euro down to the 1.1156 area, which will lead to the closure of a number of long positions and a larger decrease to 1.1102, where I recommend taking profits.
Signals of indicators:
Moving averages
Trading is above 30 and 50 moving averages, which indicates a continuation of the bullish trend.
Bollinger bands
A break of the upper boundary of the indicator in the region of 1.1257 will lead to a new wave of euro growth, while the lower boundary of the indicator in the region of 1.1160 will act as support.
Description of indicators
- Moving average (moving average determines the current trend by smoothing out volatility and noise). Period 50. The graph is marked in yellow.
- Moving average (moving average determines the current trend by smoothing out volatility and noise). Period 30. The graph is marked in green.
- MACD indicator (Moving Average Convergence / Divergence - Moving Average Convergence / Divergence) Fast EMA period 12. Slow EMA period 26. SMA period 9
- Bollinger Bands (Bollinger Bands). Period 20