
Trend analysis
This week, the price will move down with the first target of 1.1295 with a rolling level of 38.2% (yellow dotted line).
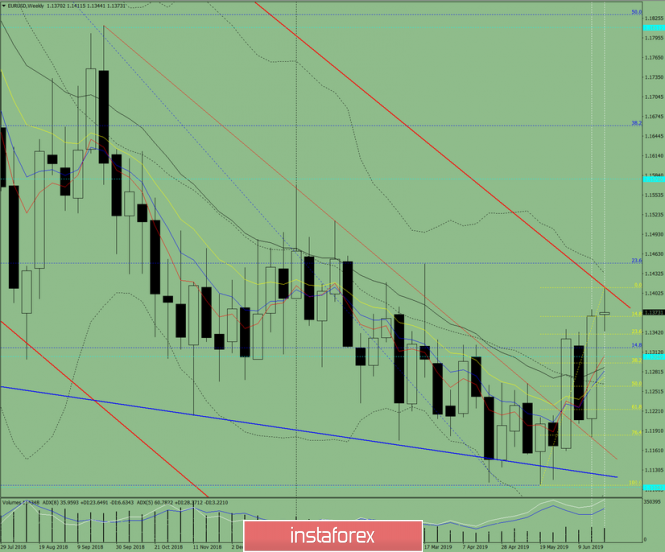
Fig. 1 (weekly schedule).
Comprehensive analysis:
- indicator analysis - down;
- Fibonacci levels - down;
- volumes - down;
- candlestick analysis - down;
- trend analysis - down;
- Bollinger lines - down;
- monthly schedule - down.
Conclusion on a comprehensive analysis - a downward movement.
The total result of the calculation of the EUR/USD candle on a weekly schedule: the price is more likely to have a downward trend for weeks with the presence of the first upper shadow at the weekly black candle (Monday - up) and the absence of the second lower shadow (Friday - down).
The material has been provided by InstaForex Company - www.instaforex.com