
To open long positions on GBP/USD you need:
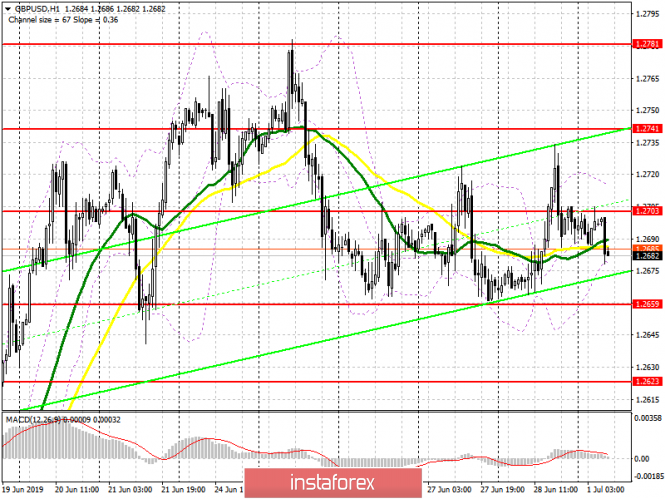
Pound buyers need to maintain the level of 1.2660, and the formation of a false breakout there will be another signal to open long positions. The goal of GBP/USD buyers will be to return to the resistance of 1.2703, which was formed at the end of last week, which will lead to an update of the highs in the region of 1.2741 and 1.2781, where I recommend to take profit. In the scenario of further decline of the pound, it is best to return to long positions on the rebound from the low of 1.2623.
To open short positions on GBP/USD you need:
Taking into account the sum of the G20 summit, bears will once again attempt to break through the support of 1.2660, which will increase the pressure on the pound and lead to an update of the low around 1.2623 and 1.2582, where I recommend taking profits. If in the first half of the day the bulls form an upward correction, you can count on sales from the resistance of 1.2703, provided that a false breakdown is formed, or on a rebound from a high of 1.2741.
Indicator signals:
Moving averages
Trading is below 30 and 50 moving averages, which indicates a downward correction in the pair.
Bollinger bands
The upward correction will be limited to the upper boundary of the channel in the 1.2695 area, while the downward movement may be limited to the lower boundary of the indicator in the 1.2645 area.
Description of indicators
- MA (moving average) 50 days - yellow
- MA (moving average) 30 days - green
- MACD: fast EMA 12, slow EMA 26, SMA 9
- Bollinger Bands 20