
To open long positions on EURUSD you need:
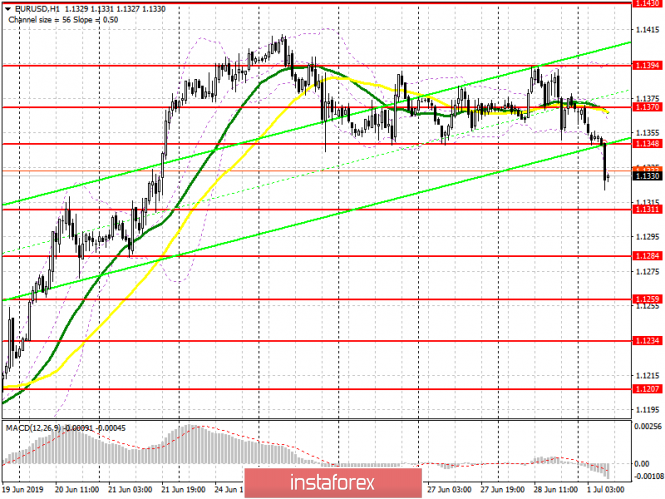
The decision of the two leaders to continue working on the agreement led to a fall in the EUR/USD pair. The trend is gradually changing. Therefore, at the moment, it's best to expect long positions after updating larger support levels around 1.1311 and 1.1284, but the main objective of the bulls will be to return to a resistance of 1.1348, above which we can talk about a false breakdown of the range of 1348 and a continuation of the medium-term strengthening of the European currency against the US dollar.
To open short positions on EURUSD you need:
Bears broke below the support of 1.1348, and their main task for today will be to keep this range. The formation of a false breakout on it will be a signal to open short positions in continuing the euro's decline in areas of lows at 1.1311 and 1.1284, where I recommend taking profits. If the bulls return to the market and consolidate above the level of 1.1348, for a bearish scenario, all will not be lost. Search for short positions in this case, you can rebound from a resistance of 1.1370, where sellers will try to form the upper limit of the new downward price channel.
Indicator signals:
Moving averages
Trade is conducted below 30 and 50 moving average, which indicates the formation of a bear market.
Bollinger bands
In case of an upward correction, the average indicator boundary around 1.1370 will act as resistance.
Description of indicators
- MA (moving average) 50 days - yellow
- MA (moving average) 30 days - green
- MACD: fast EMA 12, slow EMA 26, SMA 9
- Bollinger Bands 20