
In June, after reaching the support line (blue bold line), the price made a rally up. The market, moving up, reached the 13 average EMA - 1.1412 (yellow thin line), but closed below. Here is the line of resistance of the downward channel - 1.1430 (red bold line). It will be difficult to break through this area from the first price attempt. A comprehensive analysis should show where the price will move further.
Trend analysis.
July may begin with a downward movement, with the first target of 1.1305 - the historical level of support (blue dashed line).
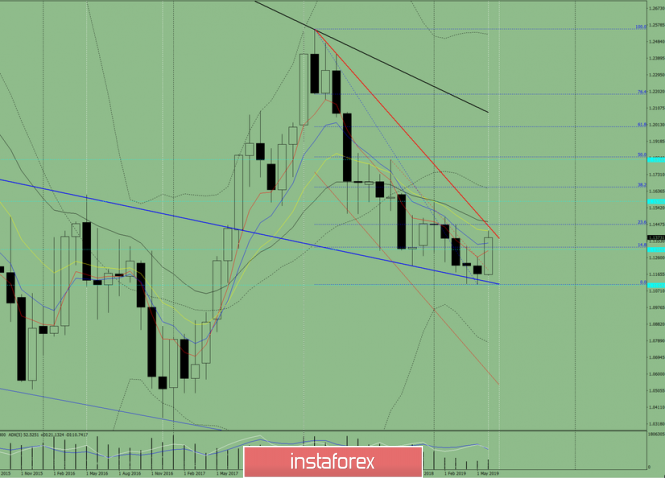
Fig. 1 (monthly schedule).
Indicator analysis:
- indicator analysis - down;
- Fibonacci levels - up;
- volumes - down;
- candlestick analysis - down;
- trend analysis - down;
- Bollinger lines - down;
Conclusion of the complex analysis - most likely, the lower work.
The overall result of the calculation of the EUR / USD currency pair candle on the monthly chart: the price is most likely to have a downward trend with the absence of the first upper shadow (the first week of the month is the lower) of the monthly black candle and the second lower shadow (the last week is white).
The material has been provided by InstaForex Company - www.instaforex.com