
To open long positions on GBP/USD you need:
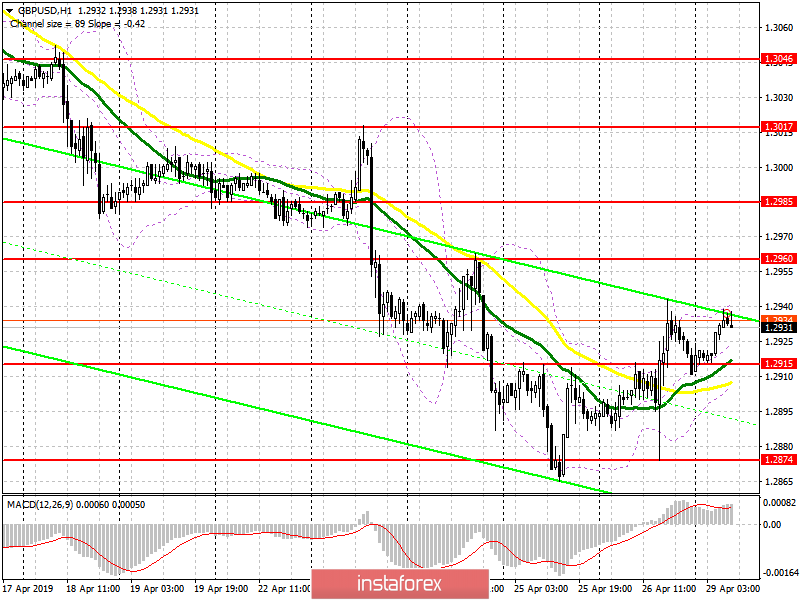
Buyers returned to the resistance level of 1.2915, and their main task for the first half of the day will be to keep this range. The formation of a false breakdown there will be a new signal for opening long positions based on a breakthrough and consolidation above a resistance of 1.2960, which will open a direct path to the highs of 1.2990 and 1.3017, where I recommend taking profits. In case the pound declines below the level of 1.2915, long positions can be returned to rebound from the support of 1.2870.
To open short positions on GBP/USD you need:
The bears will expect an unsuccessful consolidation in the morning, above the resistance of 1.2960, which will lead to the formation of a small wave of pressure on the pound and an attempt to consolidate below the range of 1.2915, which is the middle of the side channel. In case of growth above 1.2960, GBP/USD can be sold to rebound from a high of 1.2990. The main purpose of the bears today will be to return to the lower boundary of the side channel of 1.2870.
Indicator signals:
Moving averages
Trade is conducted in the region of 30 and 50 moving averages, which indicates the likely completion of a downward trend.
Bollinger bands
In case the pound declines, support may be provided by the lower limit of the indicator in the area of 1.2910.
Description of indicators
- MA (moving average) 50 days - yellow
- MA (moving average) 30 days - green
- MACD: fast EMA 12, slow EMA 26, SMA 9
- Bollinger Bands 20