
BTC price did break the bearish flag pattern in the background, which is sign for further downward movement. The resistance at $5.441 didn't hold like support, which is another sign that buyers lack power for any larger break.
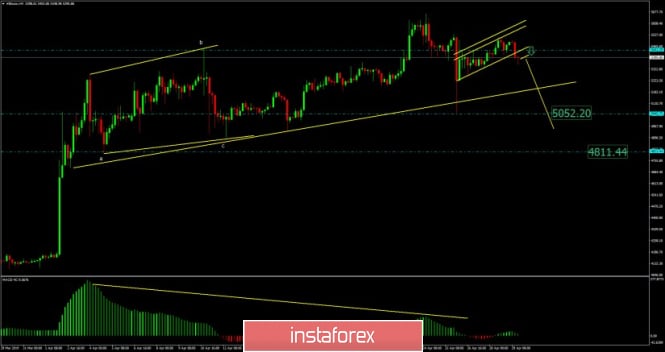
Yellow upward channel – Bearish flag pattern
Lower big diagonal - major short-term support
We found big bearish divergence on MACD oscillator on the H4 time-frame, which is strong sign that weakness is coming. Support levels are seen at the price of $5.052 and $4.811. Key resistance levels are set at the price of $5.518 and $5.644. Since the strong impulsive downward wave in the background, we expect at least testing of $5.052. Watch for selling opportunities.
The material has been provided by InstaForex Company - www.instaforex.com