
To open long positions on EURUSD you need:
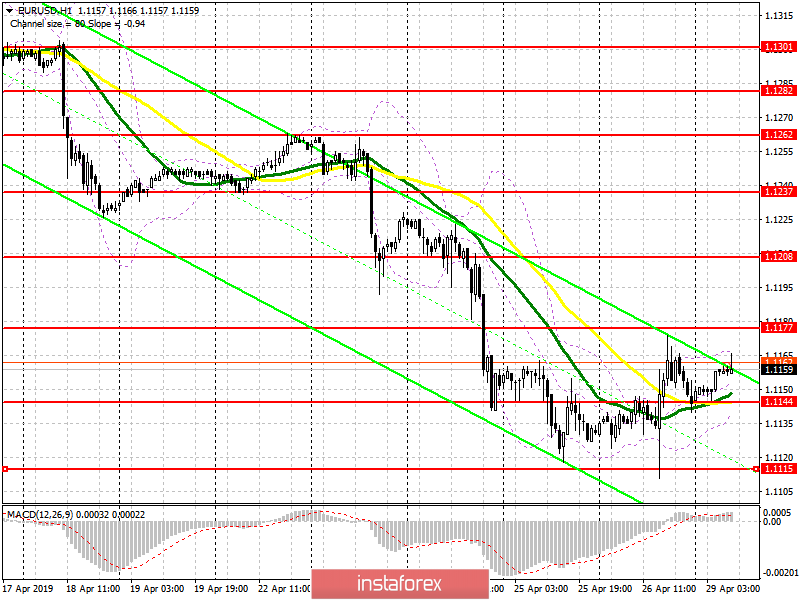
After an unsuccessful attempt on Friday to continue strengthening the US dollar, amid a good report on US GDP, euro buyers returned to the level of 1.1144, and as long as trade is conducted above this range, demand will remain. Forming a false breakdown in this range in the first half of the day will be a signal to buy EUR/USD with the aim of breaking through and consolidating above the important resistance of 1.1177, which will open a direct path to a high of 1.1208 and 1.1237, where I recommend taking profits. When the decline scenario is below the level of 1.1144, long positions can be returned to rebound from 1.1115.
To open short positions on EURUSD you need:
An unsuccessful attempt to consolidate at the level of 1.1177 will be a signal to open short positions in the euro with the aim of declining and consolidating at a low of 1.1144, a breakdown of which will lead EUR/USD to the support area of 1.1115, where I recommend taking profits. With the growth of the euro above the resistance of 1.1177 in the first half of the day, and this can happen only after the release of a good report on consumer confidence in the eurozone, it is best to open short positions to rebound from a high of 1.1208.
Indicator signals:
Moving averages
Trade is conducted in the region of 30 and 50 moving averages, which indicates the likely completion of a downward trend.
Bollinger bands
Volatility is low, which does not provide signals to enter the market.
Description of indicators
- MA (moving average) 50 days - yellow
- MA (moving average) 30 days - green
- MACD: fast EMA 12, slow EMA 26, SMA 9
- Bollinger Bands 20