
Gold price continues to consolidate above critical support area of $1,220. Prices bounced both times we saw a pull back towards that level and this is a bullish sign. However bulls will need more than this. Bulls will need to break above $1,237-40 resistance area where we also find the 38% Fibonacci retracement of the entire decline from $1,365.
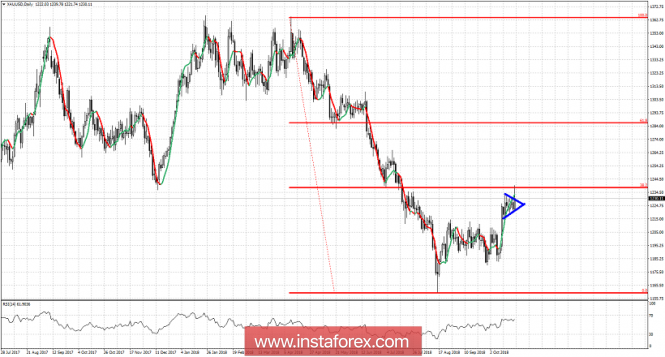
Gold price broke above the triangle pattern and is now trading above it. Price has stopped at the major resistance level of 38% Fibonacci retracement. Bulls need to break above it in order to continue higher towards $1,260-70 area. Support is found at $1,227 and next and most important at $1,220. Breaking below $1,220 could bring Gold prices towards $1,200 or even lower.
The material has been provided by InstaForex Company - www.instaforex.com