
To open long positions on EUR / USD, you need:
The ECB left rates unchanged, which did not lead to significant changes in the market compared with the morning forecast, which is relevant for the second half of the day. It is best to return to purchases when a false breakdown is formed in the support area of 1.1382 or to rebound from a minimum of 1.1351. The main task of the buyers will be to consolidate above the resistance of 1.1429, where the 50-day average is located, which will lead to a larger correctional growth in the maximum area of 1.1474, where I recommend fixing the profits.
To open short positions on EUR / USD, you need:
Sellers need to form a false breakdown at the resistance level of 1.1429, which will be a signal to open short positions in the euro in order to update yesterday's lows in the support area of 1.1382. The breakthrough of this range will increase the pressure on the euro, which will lead to a test of the levels of 1.1351 and 1.1299, where I recommend fixing the profits. In the case of growth above the resistance level of 1.1429 in the first half of the day, short positions can be returned to the rebound from the level of 1.1474.
Indicator signals:
Moving Averages
Trade is conducted under the 30- and 50-day average, which indicates the formation of a downward trend in the euro.
Bollinger bands
The lower limit of the Bollinger Bands indicator is located in the 1.1390 area and can support the euro in the event of a decline. Its breakdown will lead to a larger sale of EUR / USD. The upper limit around 1.1420 limits the upside potential of the euro.
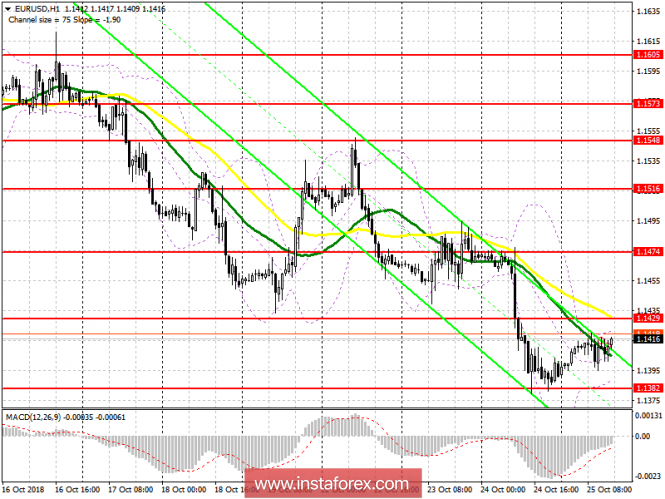
Description of indicators
- MA (moving average) 50 days - yellow
- MA (moving average) 30 days - green
- MACD: fast EMA 12, slow EMA 26, SMA 9
- Bollinger Bands 20