
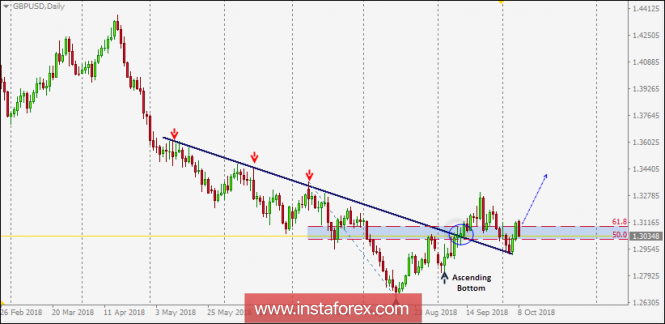
On September 13, the depicted daily downtrend line which came to meet the pair around 1.3025-1.3090 failed to offer enough bearish pressure on the pair. Since then, the GBP/USD pair has been demonstrating a successful bullish breakout so far.
On September 21, the GBP/USD short-term outlook turned to become bearish towards 1.3010 (50% Fibonacci level) and 1.2940 (recent demand level) where the backside of the broken uptrend was retested.
Recently, the price level of 1.2900-1.2940 (the backside of the broken uptrend) demonstrated significant bullish recovery where the current bullish movement was initiated.
The current bearish decline shouldn't exceed the price level of 1.3010 (50% Fibo level), so that a further bullish advance can occur towards 1.3100, 1.3210 and 1.3290.
Any bearish breakdown below 1.3000 invalidates the bullish breakout scenario allowing a further decline towards 1.2910 (previous weekly low).
The material has been provided by InstaForex Company - www.instaforex.com