
To open long positions on EUR / USD, you need:
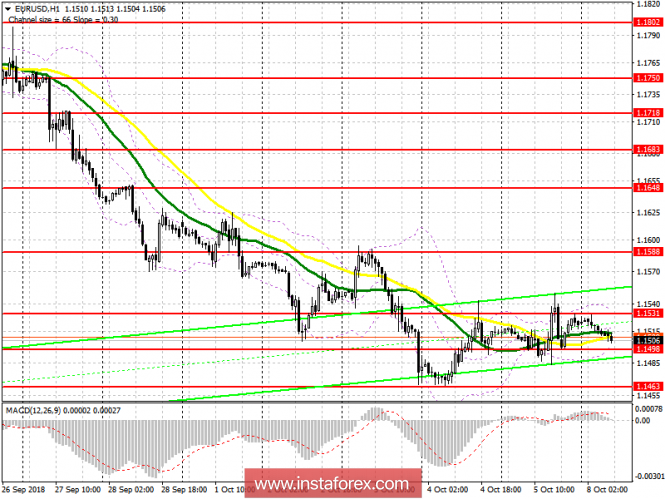
We are waiting for you with low market volatility due to Columbus Day in the United States. Today, in the first half of the day of the purchase, you can look after the decline and the formation of a false breakdown in the support area of 1.1498-1.1495 with the main goal of returning and fixing above the resistance level of 1.1531, which will lead to an update of a larger level of 1.1588, where I recommend fixing the profits. In the case of a decrease under the support area of 1.1498, long positions can be returned to the rebound from the minimum of the month of 1.1463.
To open short positions on EUR / USD you need:
Sellers will try to form a false breakdown in the resistance area of 1.1531-1.1535, which will lead to another wave of euro decline. However, the main goal will be the breakdown and consolidation below the support level of 1.1498, which will resume the downtrend and allow you to retest at least 1.1463 a month, where today I recommend taking profits on short positions. If the euro rises above 1.1531 in the first half of the day, you can immediately return to sales to rebound from a maximum of 1.1588.
Indicator signals:
Moving averages
The price is stuck between 30 and 50 average, which indicates the uncertainty in the market.
Bollinger bands
The Bollinger Bands indicator does not give signals when entering the market and indicates that the volatility remains low.
Description of indicators
MA (moving average) 50 days - yellow
MA (moving average) 30 days - green
MACD: fast EMA 12, slow EMA 26, SMA 9
Bollinger Bands 20
The material has been provided by InstaForex Company - www.instaforex.com