The dollar has accepted the punch from Trump and the corrective developments dictate the conditions on the main currency pairs. The Asian stock market is "enjoying" the disruption of USD domination; similarly, in the commodity market, the valuation in the American currency is adjusted.
The American president accused China and the European Union of manipulating exchange rates. He again expressed his dissatisfaction with the interest rate increases made by the Fed.
Not everywhere, however, the dollar is decreasing, because the developments of the emerging market were mixed. ZAR grew strong, but TRY remained weak after Trump's comments that relations with Turkey are not improving. USD/TRY does not move away to 6.10.
Minutes from the RBA meeting went unnoticed - the bank repeated that there are currently no reasons to change attitude. AUD ignored the publication, just as it was insensitive to political reports - Australian Prime Minister Turnbull survived the motion for a vote of confidence, which distanced the specter of the accelerated election.
On the stock market, traders can feel the positive impact of USD weakness, as well as sustained hopes for easing the US-China trade dispute. Shanghai Composite grew 1.2% today, but Japanese Nikkei is gaining only 0.3%, which is partially inhibited by USD / JPY decreases.
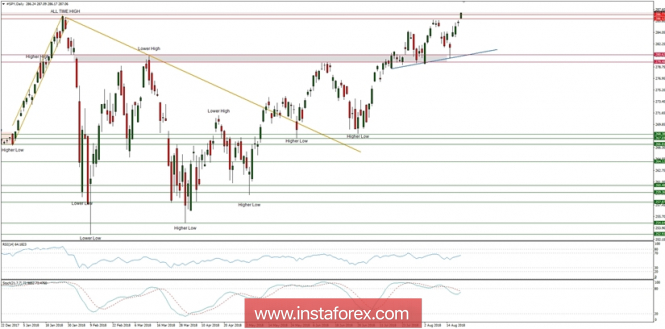
Let's now take a look at the S&P500 technical picture at the H4 time frame chart. The market is trading at the new all-time highs at the time of writing this article, so this would be the level of 286.80. The nearest technical support is seen at the level of 286.77 and 286.12. The target for bulls is currently unknowm but it is worth to notice, that the market conditions are now overbought and there is a visible bearish divergence between the price and momentum oscillator.