
Technical outlook:
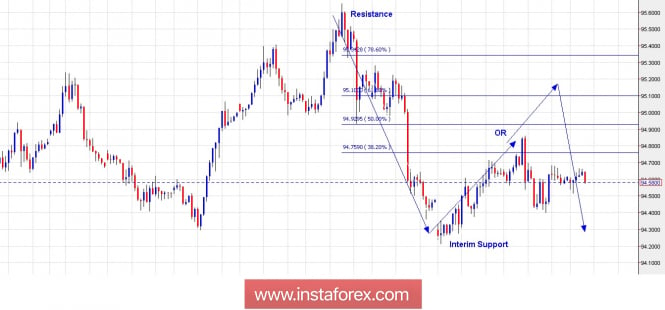
The US Dollar Index managed to test the Fibonacci 0.382 resistance of the entire drop between 95.50 through the 94.20 levels, respectively. After hitting resistance at 94.80 yesterday, the index pulled back significantly, indicating that a potential lower top is in place now. As an alternate though, there is enough room left to push through the 95.10/20 levels, which is the Fibonacci 0.618 resistance, before continuing lower again. The charts are indicating that the US Dollar Index has carved out a major top at the 95.50 levels, and that the prices should stay below that to complete a meaningful counter trend drop towards the 91.00/92.00 levels, respectively. Looking at the bigger picture, the index is expected to retrace its previous rally between 87/88 through the 95.50 levels before resuming its uptrend.
Trading plan:
Remain short now and also look to add further around the 95.10 levels, stop above 95.50 and target at 92.00.
Fundamental outlook:
There are no major events lined up today.
Good luck!
The material has been provided by InstaForex Company - www.instaforex.com