MG Network

something big isHappening!

In the mean time you can connect with us with via:

Copyright © Money Grows Network | Theme By Gooyaabi Templates

Money Grows Network

Archive

Powered by Blogger.

Welcome To Money Grows Network

Verified By

2006 - 2019 © www.moneygrows.net

Investments in financial products are subject to market risk. Some financial products, such as currency exchange, are highly speculative and any investment should only be done with risk capital. Prices rise and fall and past performance is no assurance of future performance. This website is an information site only.

Popular

Pages

Expert In

Name*


Message*

Technical analysis of Gold for July 25, 2018

Gold price started the day yesterday by falling below $1,220 only to gradually get back above it and test the short-term resistance of $1,230. The price remains inside the downward sloping wedge pattern.

analytics5b581dddd437e.png

Black lines - wedge pattern

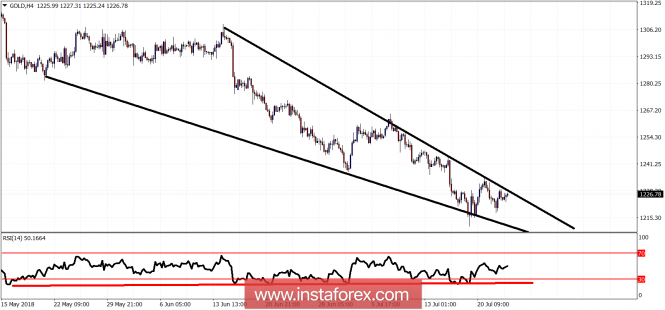
Red line - RSI bullish divergence

Gold price has short-term resistance at $1,230 and next at $1,235. Breaking above these two levels will be a bullish sign as the price will have broken out and above the wedge pattern. Next important short-term resistance will be at $1,245. Trend remains bearish for Gold. Support is at $1,223 and the next one is at $1,218. Breaking below this area will open the way for another new lower low towards $1,200 or even below it.

The material has been provided by InstaForex Company - www.instaforex.com