
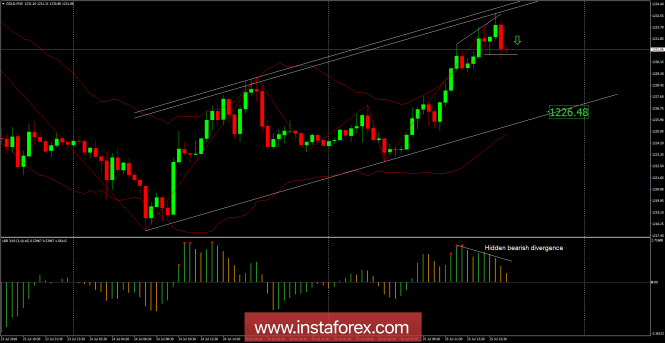
Recently, Gold has been trading upwards. The price tested the level of $1,233.70. Anyway, according to the H1 time – frame, I found a potential end of the upward movement since the price tested the top band of the Keltner channel, which is a sign that buying looks very risky. I also found a bearish engulfing candle pattern, which is another sign that buying looks risky. My advice is to watch for potential selling opportunities. The downward target is set at the price of $1,226.50.
Resistance levels:
R1: $1,230.55
R2: $1,235.75
R3: $1,241.95
Support levels:
S1: $1,219.15
S2: $1,212.97
S3: $1,207.75
Trading recommendations for today: watch for potential selling opportunities.
The material has been provided by InstaForex Company - www.instaforex.com