
Price got rejected at the resistance of 1.32 last week and remains inside the downward sloping wedge pattern. There are bullish divergence signs but no reversal confirmation yet. Key support remains at 1.30 and if broken we could see a push much lower.
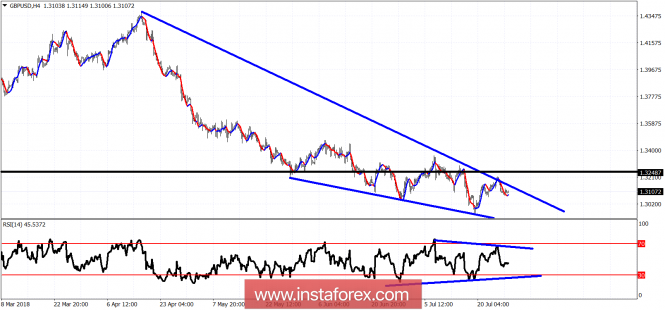
Blue triangle -RSI triangle pattern
Black line - horizontal resistance
The first important resistance bulls must overcome is at 1.32. Next is at 1.3250. The RSI remains also inside the triangle pattern and as long as we do not see a break out, we might see the GBPUSD pair slide lower inside the wedge pattern towards 1.2850. A break above 1.3160 would be an initial bullish signal that will give hope to bulls for a confirmed breakout and reversal of trend.
The material has been provided by InstaForex Company - www.instaforex.com