
USD / JPY
As we assumed in the latest review of the yen (July 26), the price managed to hold onto the red trend line with additional support of the balance line (red indicator line). The yen was supported by its own data: the growth of prices for corporate services from 1.0% y / y to 1.2% y / y in the June estimate, the basic CPI of Tokyo in July (0.8% y / y against 0.7% y / y in June), US GDP growth for the 2nd quarter by 4.1%, with no European speculative and psychological uncertainties, and today's retail sales in Japan for June, showing an increase from 0.6% y / y up to 1.8% y / y, with the expectation of 1.7% y / y.
The Japanese stock index Nikkei 225 today loses 0.75%, which happened after the Friday collapse of the American S & P500 by 0.66%. But the fall of the US market is also largely due to psychological factors. Markets down pulled social networks Facebook and Twitter, which showed good quarterly reporting, but reported a decrease in the number of subscribers due to the introduction of bots.
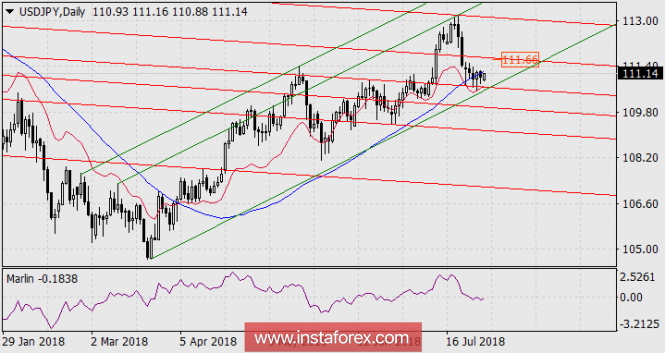
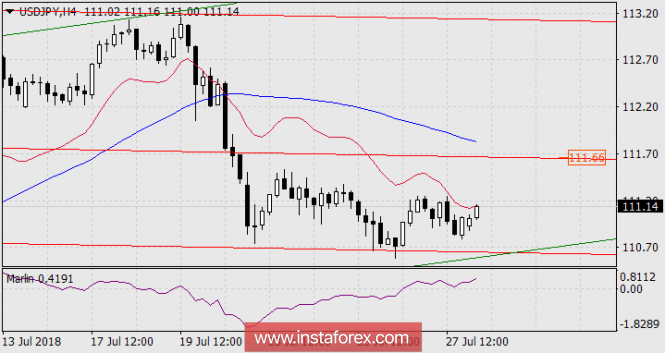
We constructed the rising price channel by a hypothetical method, that is, without confirmation by the second touch point (green bottom support), the guideline here is the correct channel resistance lines. But this construction shows us that the price is squeezed in a wedge formed by the support of the green line and the resistance of the red (with a price point of 111.66). Also the resistance is the line of Kruzenshtern (blue). The signal line of the oscillator is Marlin showing a turn from the border with a zone of negative numbers, a zone of decline in the trend. On the graph of H4, this line is already in the growth zone.
By the combination of circumstances, we expect a lateral price movement, support for the ascending green channel should still receive a touch at the price, before the hypothetical channel is re-formed into a regular worker.
The material has been provided by InstaForex Company - www.instaforex.com