
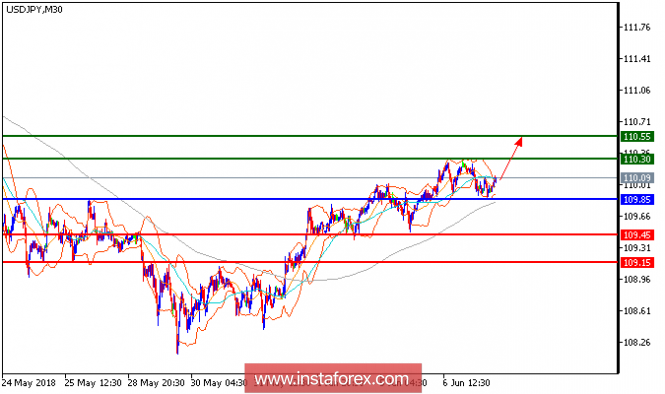
USD/JPY is expected to trade with a bullish outlook. The pair keeps trading higher while being supported by the ascending 50-day moving average. It has managed to hold the key 110.00 level as it is around the 20-period moving average. A key support level has been located at 109.85 (a reaction low seen yesterday, June 6). The intraday outlook is still bullish, and the pair should target 110.55 on the upside.
Fundamental Overview: The dollar fell yesterday, weighed down by weaker-than-expected U.S. economic data and a rising euro. U.S. worker productivity rose more slowly than originally estimated in the first three months of 2018, a potential headwind to stronger economic growth going forward. According to Commerce Department, the U.S. exported a record amount of oil and fuel in April, helping to narrow the nation's trade gap while giving the economy a lift. The country shipped $19.9 billion in petroleum, a category that includes crude oil, liquefied gases and fuels such as gasoline to other countries in April. Investors have been quick to react to U.S. economic data in recent weeks, as they try to gauge the pace at which the Federal Reserve will tighten monetary policy this year. Signs that uneven growth could give the Fed pause tend to hurt the dollar, as expectations of higher rates make the currency more attractive to yield-seeking investors.
Chart Explanation: The black line shows the pivot point. Currently, the price is above the pivot point which is a signal for long positions. If it remains below the pivot point, it will indicate short positions. The red lines show the support levels, while the green line indicates the resistance levels. These levels can be used to enter and exit trades.
Resistance levels: 110.30, 110.55, 110.80Support levels: 109.45, 109.15, 108.90
The material has been provided by InstaForex Company - www.instaforex.com