
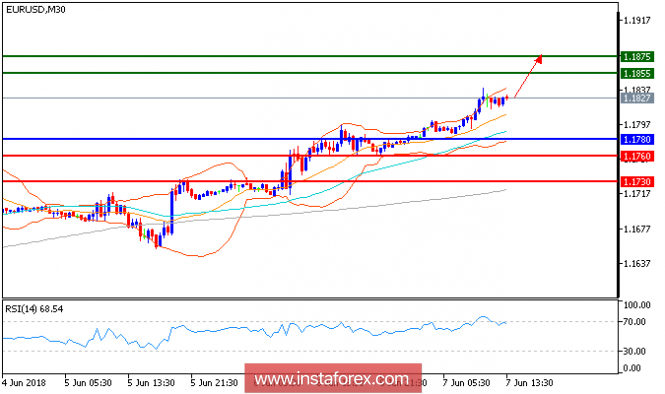
Technical Outlook: EUR/USD is expected to trade with a bullish outlook. The pair has reached the upper Bollinger band, calling for an upward acceleration toward the overhead resistance at 1.1875. Support is provided by the ascending 20-period moving average, which stays above the 50-period one. And the relative strength index is well directed in the 60s, showing continued upward momentum for the pair. Intraday bullishness persists, and the pair should target 1.1875 upon crossing 1.1855. Key support should be found at 1.1780.
Fundamental Overview: Exports of goods and services eased growth in the eurozone in the first three months of 2018. This is a sign the currency area's recovery may be vulnerable to the trade dispute with the U.S.
The European Union's statistics agency earlier today said that gross domestic product—the broadest measure of goods and services produced in an economy—grew at an annualized rate of 1.5% in the first quarter, slightly down on its previous estimate of 1.6% and a marked slowdown from the final quarter of 2017. Economists have largely attributed the first-quarter slowdown to a combination of unusually cold weather, strikes in the eurozone's two largest members, and a severe influenza outbreak in Germany.
Chart Explanation: The black line shows the pivot point. Currently, the price is above the pivot point which is a signal for long positions. If it remains below the pivot point, it will indicate short positions. The red lines show the support levels, while the green line indicates the resistance levels. These levels can be used to enter and exit trades.
Resistance levels: 1.1855, 1.1875, 1.1910
Support levels: 1.1780, 1.1760, 1.1730
The material has been provided by InstaForex Company - www.instaforex.com