
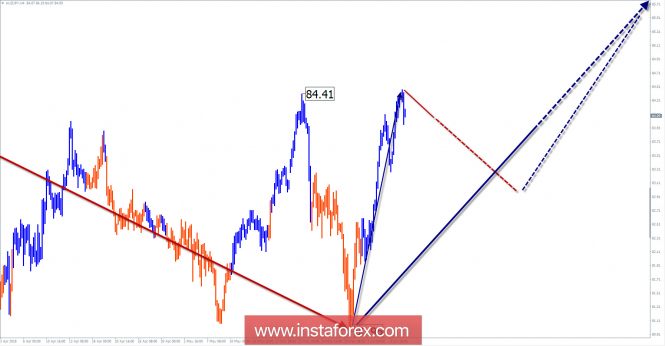
Wave picture of the H4 chart:
This scale of analysis refers to the last ascending section of the cross plot dated March 23. In a larger downward wave model, he claims a correction point. The wave is formed in the form of an "ascending flag".
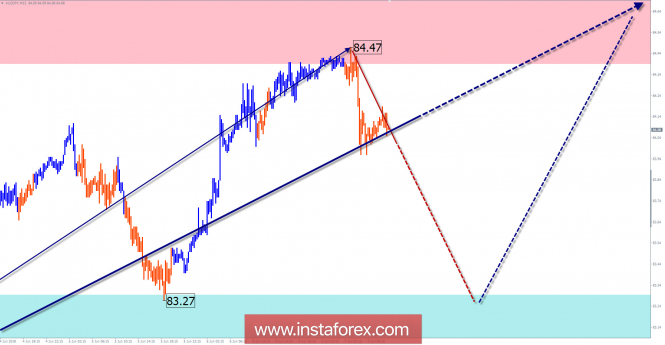
The wave pattern of the H1 chart:
The rising segment of the chart from May 30 reached the lower limit of the powerful resistance zone. The wave has a high potential, allowing to wait for the continuation of the price increase.
The wave pattern of the M15 chart:
Within the main short-term wave in recent days, there is a need for a counter correction. Given the impulse nature of the recovery, the decline is expected to be no further than the minimum level.
Recommended trading strategy:
Sales are highly risky, only possible for transactions inside the day. For traders trading above the M15 timeframe, I recommend looking for buying signals in the settlement support area.
Resistance zones:
- 84.40 / 84.90
Support zones:
- 83.30 / 82.80
Explanations to the figures:
A simplified wave analysis uses a simple waveform, in the form of a 3-part zigzag (ABC). The last incomplete wave for every time frame is analyzed. Zones show the calculated areas with the greatest probability of a turn.
Arrows indicate the counting of wave according to the technique used by the author. The solid background shows the generated structure and the dotted exhibits the expected wave motion.
Attention: The wave algorithm does not take into account the duration of the tool movements in time. To conduct a trade transaction, you need to confirm the signals used by your trading systems.
The material has been provided by InstaForex Company - www.instaforex.com