
The Dollar index as a very interesting but bearish candlestick pattern in the daily chart. An evening Doji star candlestick pattern has been formed in the daily chart, and with yesterday's red candlestick we have confirmation of the reversal. This reversal came as no surprise to us as we were prepared.
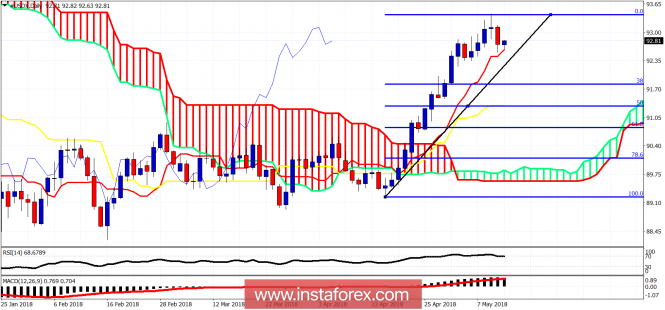
The Dollar index is expected to move lower at least towards the 38% Fibonacci retracement at 91.80. So far, the price has made higher highs and higher lows while trading above the tankan-sen (red line indicator) of the Ichimoku cloud system. This support is at 92.60. This level was also mentioned in the previous analysis as a point when broken that selling will accelerate lower. I remain bearish the Dollar index.
The material has been provided by InstaForex Company - www.instaforex.com