
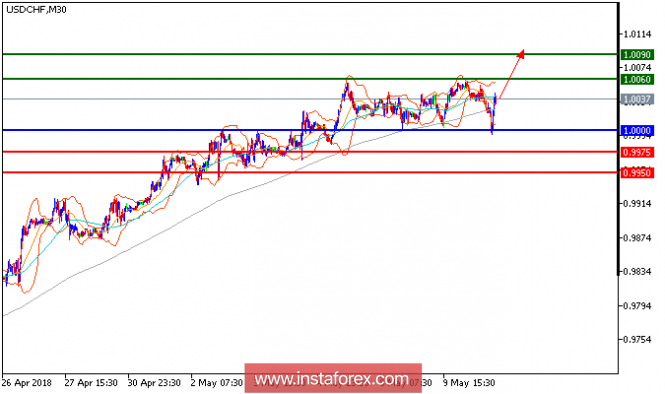
USD/CHF is expected to trade with a bullish outlook. The pair resumed its upside momentum, and is now challenging its nearest resistance at 1.0060. Both the ascending 20-period and 50-period moving averages are below the prices, and should continue to push them higher. Last but not least, the relative strength index stands firmly above its neutrality area at 50. To sum up, as long as 1.000 is not broken, look for further advance to 1.0060 and 1.0090 in extension.
Chart Explanation: The black line shows the pivot point. The present price above the pivot point indicates a bullish position, and the price below the pivot point indicates a short position. The red lines show the support levels, and the green line indicates the resistance levels. These levels can be used to enter and exit trades.
Strategy: BUY, stop loss at 1.0000, take profit at 1.0060.
Resistance levels: 1.0060, 1.0090, and 1.0120
Support levels: 0.9975, 0.9950, and 0.9900
The material has been provided by InstaForex Company - www.instaforex.com