
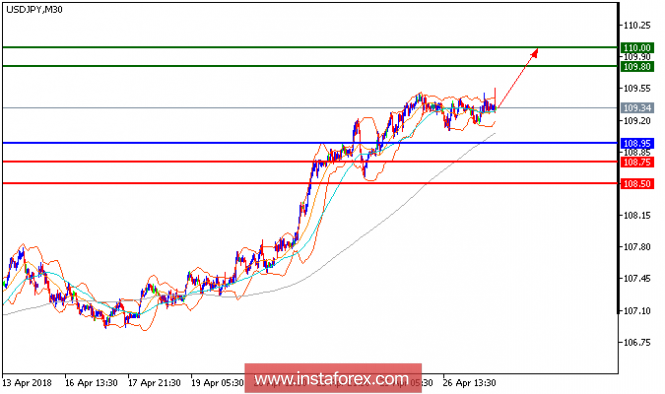
USD/JPY is expected to trade with bullish outlook. The pair is consolidating above the key support at 108.95, which should maintain the buying interest. The relative strength index broke above its neutrality level at 50, calling for a further advance. Therefore, as long as 108.95 holds on the downside, look for a rise with targets at 109.80 and 110.00 in extension.
Chart Explanation: The black line shows the pivot point. The present price above the pivot point indicates a bullish position, and the price below the pivot point indicates a short position. The red lines show the support levels, and the green line indicates the resistance levels. These levels can be used to enter and exit trades.
Strategy: BUY, stop loss at 108.95, take profit at 109.80.
Resistance levels: 109.80, 110.00, and 110.45
Support levels: 108.75, 108.50, and 108.00.
The material has been provided by InstaForex Company - www.instaforex.com