
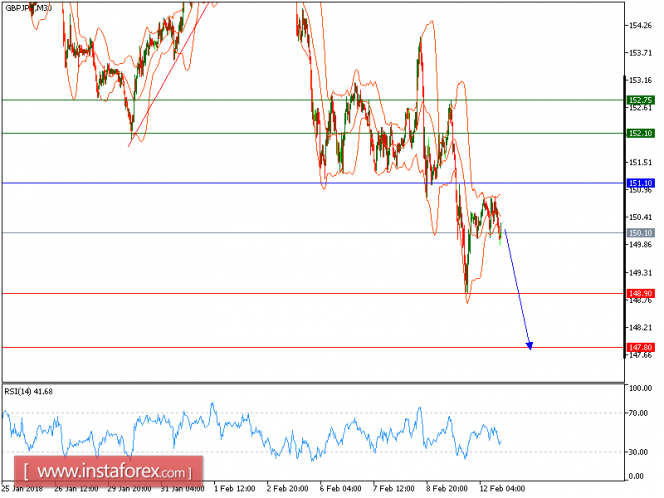
GBP/JPY is expected to trade with bearish outlook. Though the pair is rebounding and is challenging the declining 50-period moving average, it is still capped by a falling trend line since February 6. Even though a continuation of the technical rebound cannot be ruled out, its extent should be limited.
To sum up, below 151.10, look for a new drop with targets at 148.90 and 147.80 in extension.
Alternatively, if the price moves in the direction opposite to the forecast, a long position is recommended to be above 151.10 with the target at 152.10.
Strategy: SELL, Stop loss at 151.10, Take profit at 148.90
Chart Explanation: the black line shows the pivot point. The price above the pivot point indicates long positions; and when it is below the pivot point, it indicates short positions. The red lines show the support levels, and the green line indicates the resistance levels. These levels can be used to enter and exit trades.
Resistance levels: 152.10, 152.75, and 153.20
Support levels: 148.90, 147.80, and 147.00.
The material has been provided by InstaForex Company - www.instaforex.com