
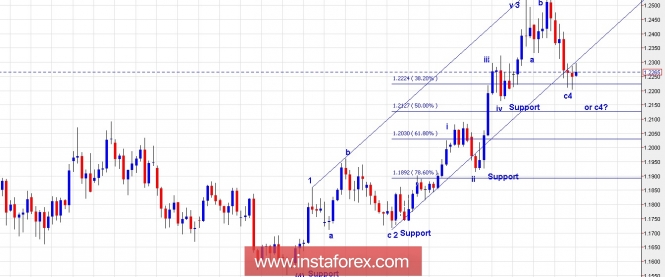
Technical outlook:
The EUR/USD pair seems to be just one leg away from terminating into its wave 4 of one lesser degree, from what has been projected on the daily chart. The pair might form just one more low below 1.2205 levels before turning higher again, or it is done and could continue higher from current levels. In either case please note that going long on dips remain a safe strategy for now. Immediate support comes in at 1.2161 levels, while interim resistance is at 1.2537 levels respectively. Also, note that the pair is finding support at the 0.382 fibonacci level of the 3rd wave of the same degree. Furthermore, the channel line support is also seen around current levels and hence one can expect turn soon. Looking at the bigger picture, the wave (5) rally should terminate above 1.2537 levels.
Trading plan:
Look to remain long with risk around 1.2250 levels.
US Dollar Index chart setups:
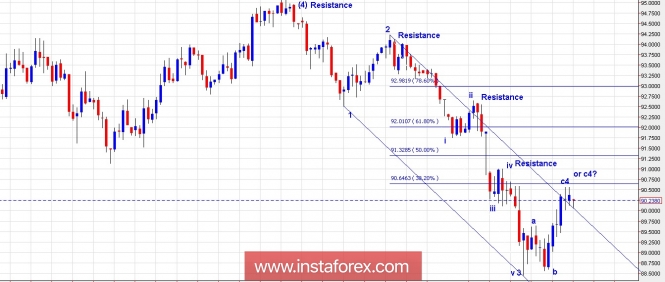
Technical outlook:
The US Dollar Index, seem to be into its last leg rally before terminating into wave 4 of a lesser degree, as depicted on the daily chart here. With respect to the price action, the 4th wave is expected to terminate around 91.00 levels before the index drops into its wave (5) of a larger degree. Immediate resistance is seen at 91.00 levels while interim support is seen at 88.40 levels respectively. Also note that the underlying is testing Fibonacci 0.382 resistance of wave 3 drops, a common relationship for wave 4 to terminate. Furthermore, the channel line resistance is also nearby, indicating a bearish turn is close. The bigger picture reveals that the US Dollar Index should terminate its 5th wave of one larger degree, below 88.40 levels.
Trading plan:
Remain short with risk above 91.00 levels.
Fundamental outlook:
No major events lined up for the day.
Good luck!
The material has been provided by InstaForex Company - www.instaforex.com