
Gold price got rejected last week at the upper cloud boundary in the 4-hour chart. Price is vulnerable to a push lower towards $1,310-$1,300 over the coming days. An important top has been made in Gold and the pullback has started.
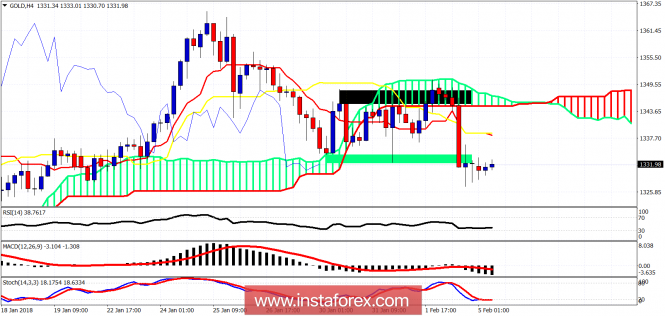
Green rectangle - support
Gold price has broken below the green rectangle support area and is trading just below it. Price is trading below the Ichimoku cloud. Trend is bearish for the short term. Resistance is at $1,338 and next at $1,345. Support is at $1,320 and $1,310.
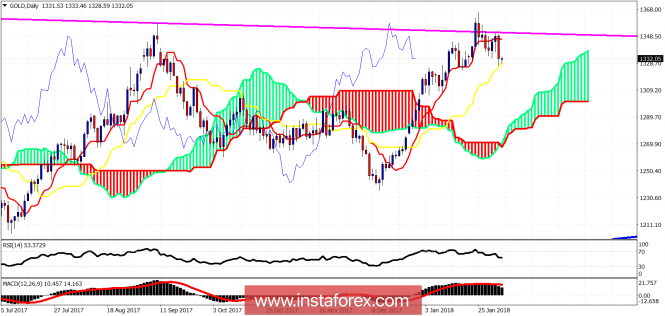
Gold was unable to break above the long-term resistance trend line and got rejected. Price broke below the tenkan-sen (red line indicator) and is testing the kijun-sen support (yellow line indicator). A daily closebelow $1,327 will open the way for a move lower towards cloud support at $1,290-$1,300.
The material has been provided by InstaForex Company - www.instaforex.com