
Technical outlook:
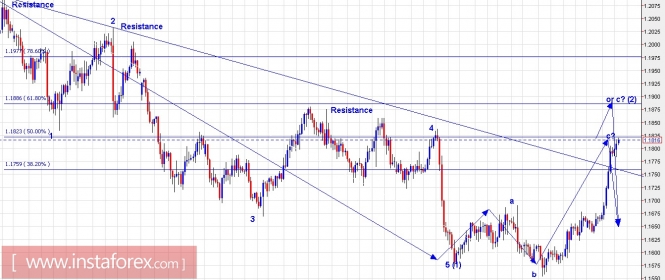
The EUR/USD pair has rallied before printing a low below 1.1550 levels recently. It is now facing the 50% fibonacci resistance of the entire drop between 1.2090 through 1.1550 levels respectively. Still at least two probable wave counts are coming up. If the entire drop between 1.2092 and 1.1550 levels should be considered as a leading diagonal, then the recent rally should prove to be corrective and find resistance soon to reverse lower again. On the other hand, if we consider the drop as A-B-C, which is not labelled here, then EUR/USD is heading north towards fresh highs. Probabilities will increase towards the latter wave count if the pair continues to trade in the buy zone. Resistance should be very strong around the 1.1870/85 levels where fibonacci 0.618 of the earlier drop is passing through.
Trading plan:
Please look to sell at least 50% around 1.1870/85 levels, stop above 1.2092 and target open.
US Dollar Index chart setups:
Technical outlook:
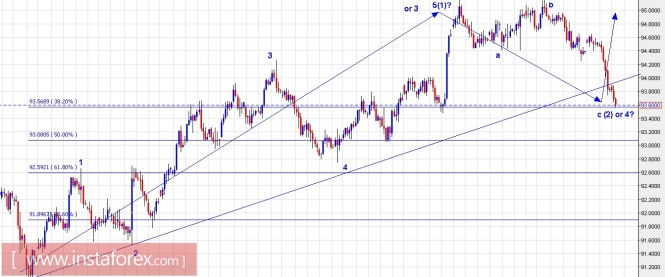
The US Dollar Index has also dropped before printing fresh highs at 95.30/50 levels and it is seen to be trading around 93.50/60 levels for now. The US Dollar Index is either producing wave 4 of the same degree or probably wave (2) of one higher degree as labelled here. In either case, a push higher is suggested from current levels. Please note that the index is seen to be trading very close to the fibonacci 0.382 support levels of the entire rally between 91.00 and 95.10 levels earlier. Furthermore, please note that the pair would find strong support around 92.80/93.00 levels, which is fibonacci 0.618 support of the earlier rally mentioned above. A high probable trade setup should be a bullish reversal around 93.00 levels going forward.
Trading plan:
Please look to go long again around 93.00/93.50 levels (at least 50% capacity), stop below 91.00, targeting 98.00 and higher.
Fundamental outlook:
Please watch out for USD Consumer Price Index at 08:30 AM EST today.
Good luck!
The material has been provided by InstaForex Company - www.instaforex.com