
Gold price continues to trade above the 4 hour Ichimoku cloud. Trend is bullish in Ichimoku terms, but price is mainly moving sideways and has not yet convincingly broken above the critical short-term resistance.
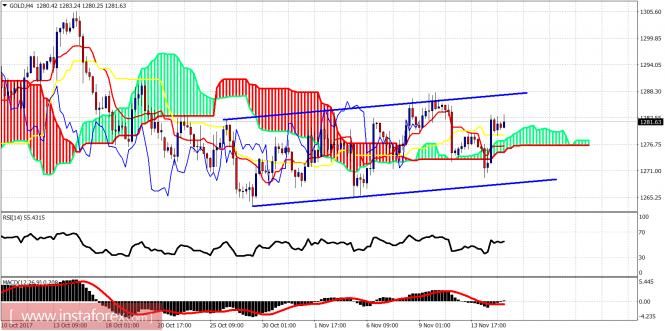
Short-term support is at $1,278 and resistance at $1,288. Price is trading above the 4 hour Kumo but there is no clear trend in pure price terms. The entire movement since late October is not impulsive and I believe that there are a lot of chances we see another strong leg downwards.
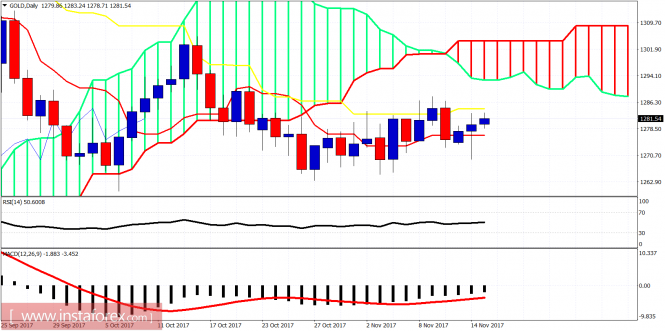
On a daily basis Gold price is trading between the kijun- and tenkan-sen. The daily chart portrays the sideways move we mentioned above very clearly as price is trapped between the two indicators. Bulls need to be very cautious as price remains below the Kumo. A break below yesterday's low at $1,269 will open the way for a move towards $1,250. A break above $1,310 will open the way for a move to $1,400
The material has been provided by InstaForex Company - www.instaforex.com