
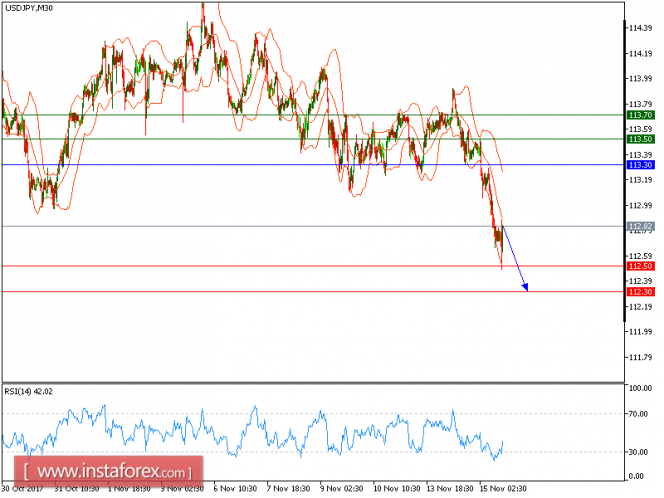
USD/JPY is under pressure. The pair is under pressure below the key resistance at 113.70. The declining 20-period and 50-period moving averages maintain the downside bias. The relative strength index lacks upward momentum.
To conclude, as long as 113.30 is not surpassed, look for a further drop with targets at 112.50 and 112.30 in extension.
Alternatively, if the price moves in the opposite direction, a short position is recommended above 113.30 with a target at 113.50.
Chart Explanation: The black line shows the pivot point. The current price above the pivot point indicates a bullish position, while the price below the pivot point is a signal for a short position. The red lines show the support levels and the green line indicates the resistance level. These levels can be used to enter and exit trades.
Strategy: SELL, Stop Loss: 113.30, Take Profit: 112.50
Resistance levels: 113.50, 113.70 and 114.05 Support Levels: 112.50, 112.30, 112.00
The material has been provided by InstaForex Company - www.instaforex.com