
Overview:
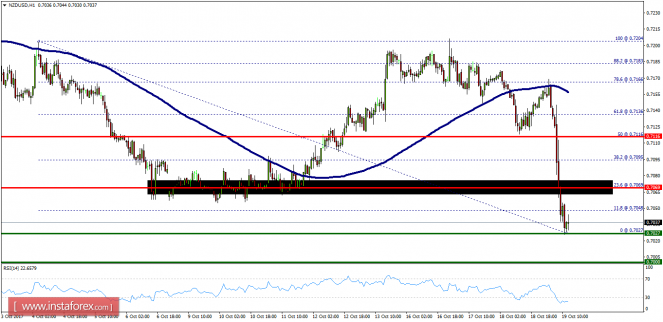
- The NZD/USD pair declined from the level of 0.7069 towards 0.7040. The kiwi has been moving between the levels of 0.7069 and 0.7040 since yesterday. The trend is still set below the 0.7069 level. The resistance for the pair is seen at the levels of 0.7069 and 0.7116. The first resistance and the second one are seen at the levels of 0.7069 and 0.7116 respectively. The NZD/USD pair is still moving in a downtrend channel. The price spot of 0.7069 remains a significant resistance area. Therefore, there is a possibility that the NZD/USD pair will move downside, and the structure of a fall does not look corrective. In order to indicate the bearish opportunity below the area of 0.7069, sell below 0.7069 with the first target at 0.7027. It should be noted that support 1 is seen at the level of 0.7027 which coincides with the double bottom in the one-hour time frame. If the NZD/USD pair is able to break out the bottom at 0.7027, the market will decline further to 0.7000 in order to test the weekly support 2. On the other hand, the stop loss should be set above the level of 0.7116 (second resistance).