
Gold price has reached the support at the 61.8% Fibonacci retracement. I expect an upward reversal from current levels. If this does not happen, we should expect gold to fall towards $1,240-50.
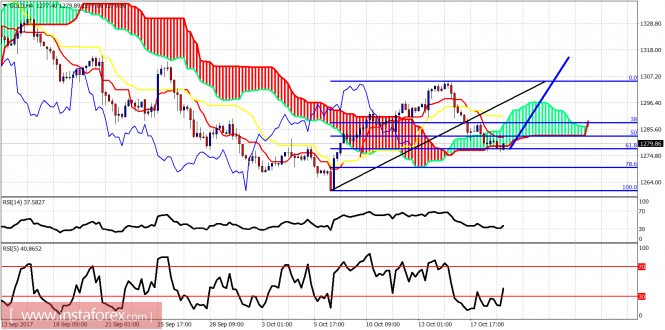
Blue line - expected move
Gold price is testing the lower Ichimoku cloud boundary and the 61.8% Fibonacci retracement. Oscillators are oversold and turning upwards. This is the important support area. Resistance is at $1,289 and the next one at $1,302.
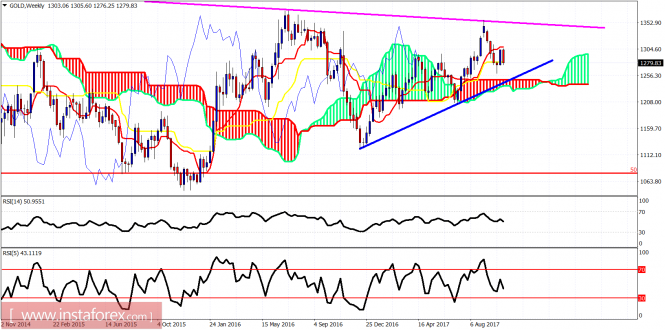
Magenta line - long-term resistance
Gold price is trading above the weekly Ichimoku cloud. This is a bullish sign. However, price got rejected a few weeks back at the magenta trend line which was our target since $1,200. In order for gold to push towards $1,400, we need to break above this resistance level. A test of cloud support and the blue trend line is still not out of the question. Any pullback is still considered a buying opportunity.
The material has been provided by InstaForex Company - www.instaforex.com