
GBP/USD has found resistance in the 200 SMA at H1 chart following a pullback made from October 13 lows. Below yesterday's lows, the pair has formed a fractal that should provide support in the short-term. If it manages to break below it, we might expect another leg lower towards the 1.3037 level. MACD indicator stays in the positive territory, favoring to the bulls.
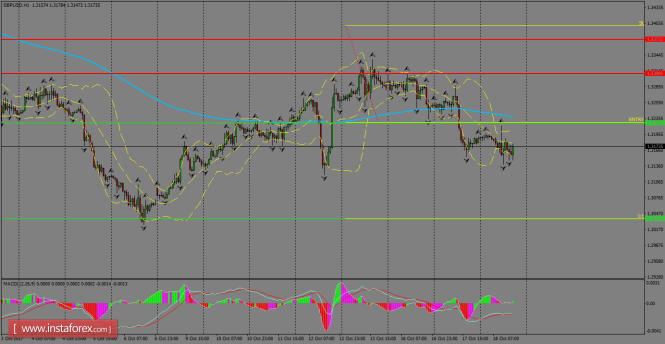
H1 chart's resistance levels: 1.3309 / 1.3373
H1 chart's support levels: 1.3216 / 1.3037
Trading recommendations for today: Based on the H1 chart, sell (short) orders only if the GBP/USD pair breaks a bearish candlestick; the support level is at 1.3216, take profit is at 1.3037 and stop loss is at 1.3398.
The material has been provided by InstaForex Company - www.instaforex.com