
USDX is consolidating the price action above the 200 SMA and opened the doors to test the resistance level of 94.58. However, that doesn't put the bulls in focus yet, as the index struggles to break a range that has been established. If we see a break below the 93.35 level, then we can expect a decline towards the psychological level of 93.00.
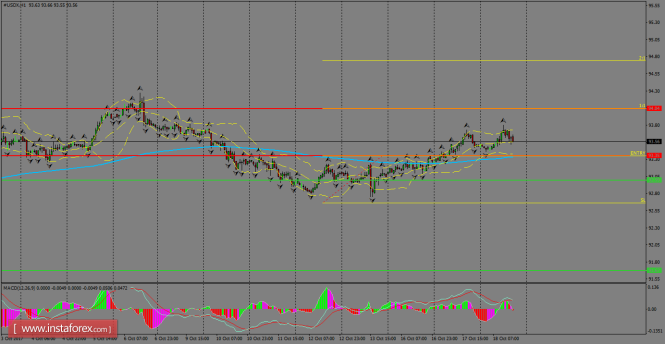
H1 chart's resistance levels: 93.35 / 94.58
H1 chart's support levels: 93.00 / 91.67
Trading recommendations for today: Based on the H1 chart, place buy (long) orders only if the USD Index breaks with a bullish candlestick; the resistance level is at 93.35, take profit is at 94.58 and stop loss is at 92.66.
The material has been provided by InstaForex Company - www.instaforex.com