
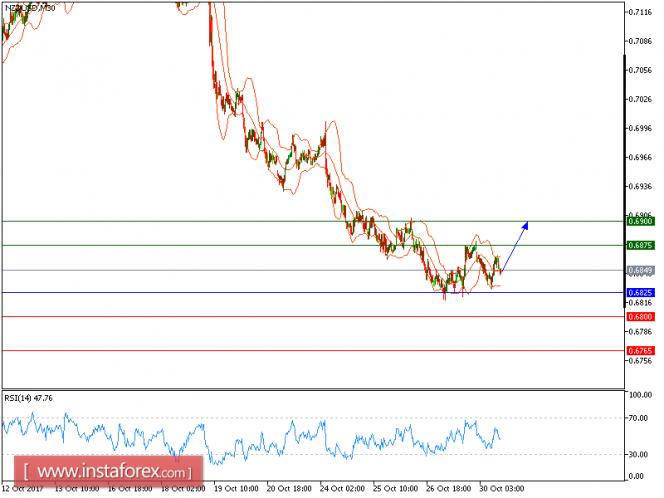
NZD/USD is expected to trade with bullish outlook above 0.6825. Although the pair broke below the 20-period moving average, it is still trading above its rising 50-period moving average, which plays a support role. The relative strength index is above its neutrality level at 50. Even though a continuation of the consolidation cannot be ruled out, its extent should be limited.
Therefore, above 0.6825, look for a further rise to 0.6875 and even to 0.6900 in extension.
The black line is showing the pivot point. Currently, the price is above the pivot point, which indicates long positions. If it remains below the pivot point, it will indicate short positions. The red lines are showing the support levels and the green line is indicating the resistance levels. These levels can be used to enter and exit trades.
Resistance levels: 0.6875, 0.6900, and 0.6935
Support levels: 0.6800, 0.6765, and 0.6735
The material has been provided by InstaForex Company - www.instaforex.com