MG Network

something big isHappening!

In the mean time you can connect with us with via:

Copyright © Money Grows Network | Theme By Gooyaabi Templates

Money Grows Network

Archive

Powered by Blogger.

Welcome To Money Grows Network

Verified By

2006 - 2019 © www.moneygrows.net

Investments in financial products are subject to market risk. Some financial products, such as currency exchange, are highly speculative and any investment should only be done with risk capital. Prices rise and fall and past performance is no assurance of future performance. This website is an information site only.

Popular

Pages

Expert In

Name*


Message*

Ichimoku indicator analysis of gold for September 1, 2017

Gold price is retesting its highs. Short-term support is being held, price continues to trade inside the bullish daily channel, Ichimoku indicators still favor the bullish scenario.

analytics59a908fc5f635.jpg

Gold price has reversed off the 50% Fibonacci retracement. Price is testing recent highs at $1,325. Support is at $1,310. If broken, we should expect price to break below $1,300 and move towards $1,295-90.

analytics59a90946b982b.jpg

Red lines - bullish channel

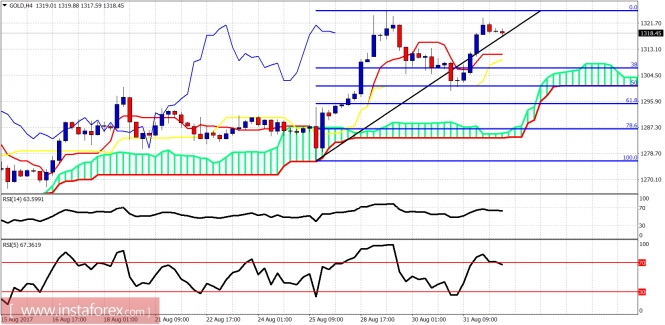
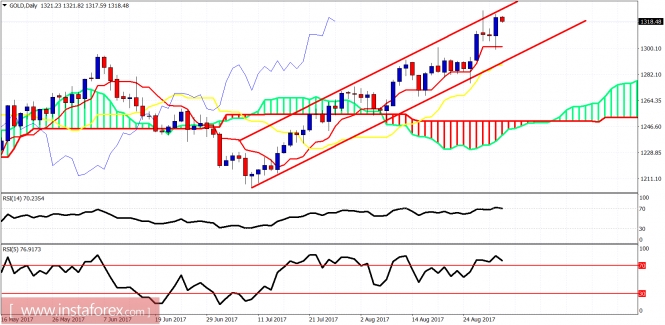
Gold price is above both the tenkan- and kijun-sen indicators on the daily chart. Price is inside the bullish channel. Daily support is at $1,300. A daily close below $1,300 could confirm a bigger correction towards $1,250-$1,280 area. Longer-term we remain bullish.

The material has been provided by InstaForex Company - www.instaforex.com