
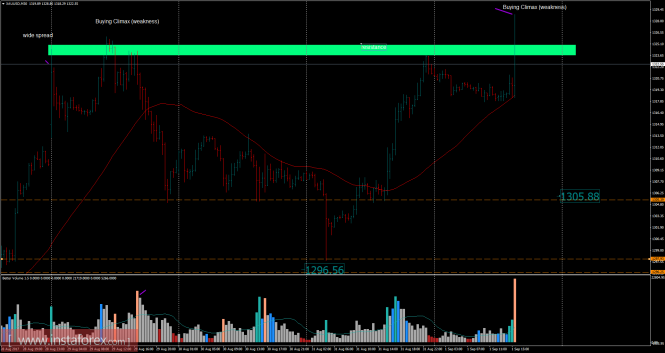
Recently, Gold has been trading upwards. The price tested the level of $1,328.85 in an ultra high volume. According to the 30M time frame, I found a wide spread bar in an ultra high volume (buying climax), which represents a strong sign of weakness. There is also a fake breakout of a resistance cluster, which is another sign of weakness. My advice is to watch for potential selling opportuntiies. The downawrd targets are set at the price of $1,315.00 and $1,305.00.
Resistance levels:
R1: $1,333.45
R2: $1.344.60
R3: $1,360.20
Support levels:
S1: $1,306.65
S2: $1,291.00
S3: $1,279.95
Trading recommendations for today: watch for potential selling opportunities.
The material has been provided by InstaForex Company - www.instaforex.com