
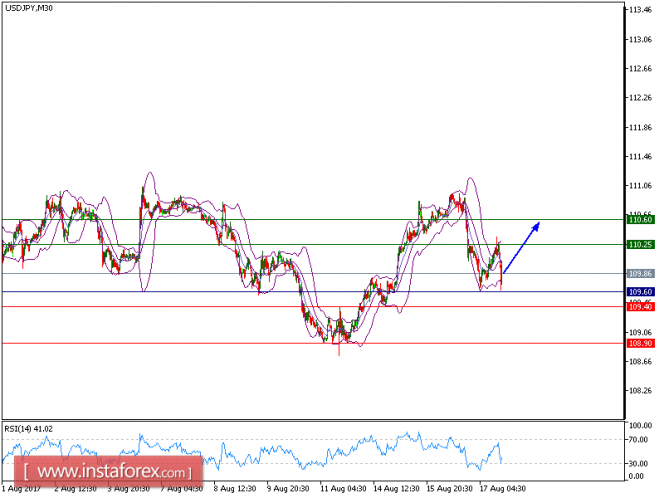
USD/JPY is expected to trade with bullish outlook. The pair has bounced up from 108.90 and is holding on the upside. The rising 20-period moving average crossed above the 50-period one and is playing a support role. The relative strength index stands firmly above its neutrality level at 50 and lacks downward momentum.
As long as 109.60 holds on the downside, look for a further advance towards 110.25, a break above this level would call for a further rise towards 110.60.
Alternatively, if the price moves in the opposite direction, a short position is recommended below 109.40 with a target at 108.90.
Chart Explanation: The black line shows the pivot point. The current price above the pivot point indicates a bullish position, while the price below the pivot point is a signal for a short position. The red lines show the support levels and the green line indicates the resistance level. These levels can be used to enter and exit trades.
Strategy: BUY, Stop Loss: 109.60, Take Profit: 110.25
Resistance levels: 110.25, 110.60, and 111.05
Support Levels: 109.40, 108.90, 109.25
The material has been provided by InstaForex Company - www.instaforex.com