
Technical outlook:
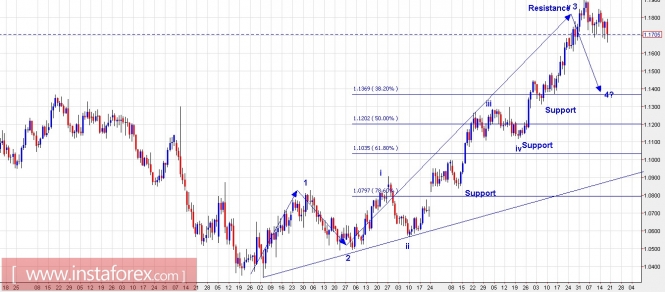
We have again presented the daily chart here to remind you of the bigger picture in EUR/USD. It has been two weeks since we discussed EUR/USD potential drop from 1.1910 levels and the pair has dropped almost 300 pips since then. Even now, the downside should remain intact towards 1.1600 and 1.1400 levels going forward. Please note that the pair looks to have completed waves 1,2 and 3 since the beginning of 2017 now, and might be working on wave 4. Furthermore, wave 4 can take a complex sideways structure since wave 2 was quite sharp as seen on the chart here. The short-term outlook will be presented tomorrow to catch up with trend and counter trend movements but overall bearish stance remains until mid 1.1300 levels, which is 38% fibonacci retracement of wave 3. Immediate support is seen close to 1.1600 levels, while resistance is found at 1.1840/50 levels. Please expect short-term pullback rallies and take it as opportunities to go short again.
Trading plan:
Please remain short, stop 1.1915, target 1.1600 and 1.1400.
GBP/USD chart setups:
Technical outlook:
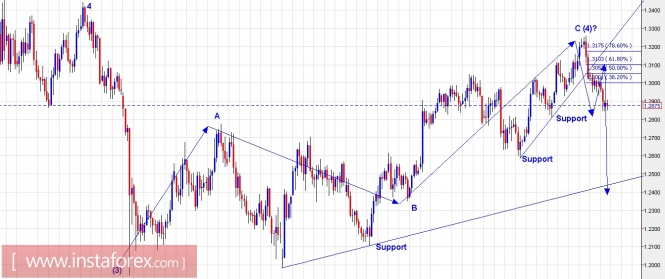
We have presented the bigger picture again to reconfirm long-term trading strategy in GBP/USD. Since the beginning of August 2017, we have remained short and prices have now dropped from 1.3267 through 1.2840 levels broadly. It already looks to have completed the first leg (impulse, 5 waves) as discussed and traded since last two weeks. As depicted here, a counter trend rally could be seen materializing anytime now, which could terminate around 1.3100 levels, which is fibonacci 0.618 resistance of the recent drop. Immediate support is seen through 1.2800 levels for now while major resistance remains at 1.3267 levels. Please be prepared for a counter trend rally through 1.3100 levels and take it as yet another opportunity to go short towards the larger down trend. Downside targets remain at 1.2600 and 1.2300 levels subsequently.
Trading plan:
Please remain flat for now and sell again around 1.3100 levels, stop at 1.3270, with target at 1.2600 and lower.
Fundamental outlook:
No major events lined up for the day.
Good luck!
The material has been provided by InstaForex Company - www.instaforex.com