
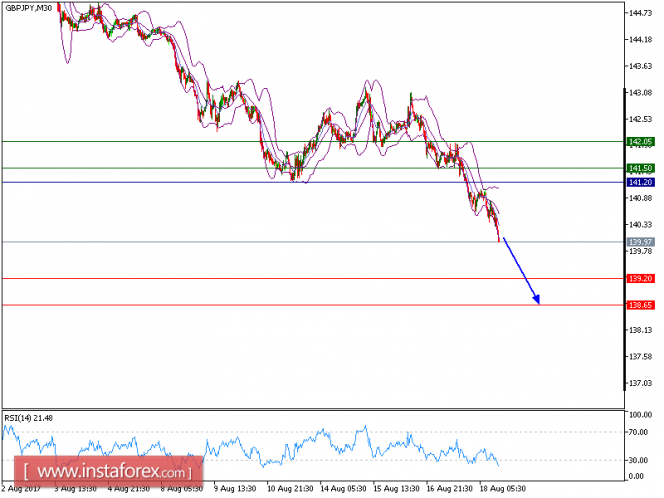
All our targets which we predicted yesterday were met. GBP/JPY is still under pressure and expected to continue the downside movement. The pair remains weak below its falling 20-period and 50-period moving averages, and is expected to post further downsides. The process of lower highs and lows remains intact, which should confirm a negative outlook. Besides, the relative strength index is still bearish, without showing any reversal signals.
To conclude, as long as 141.20 is not surpassed, the risk of a slide below 139.20 remains high. Our next down target is set at 138.65.
Alternatively, if the price moves in the opposite direction as predicted, a long position is recommended above 142.25 with the target at 142.65.
Strategy: SELL, Stop Loss: 139.20, Take Profit: 138.65.
Chart Explanation: the black line shows the pivot point. The price above the pivot point indicates the bullish position; and when it is below the pivot points, it indicates a short position. The red lines show the support levels and the green line indicates the resistance levels. These levels can be used to enter and exit trades.
Resistance levels: 141.50, 142.05, and 143.00
Support levels: 139.20, 138.65, and 138.00
The material has been provided by InstaForex Company - www.instaforex.com