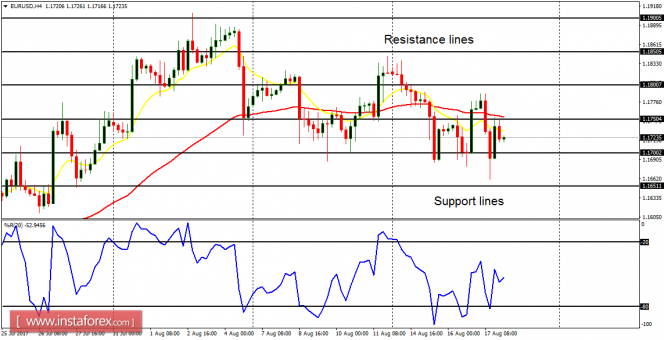
EUR/USD: The EUR/USD has only consolidated so far this week, with no much directional movement. The market is quite choppy right now, and it would make sense to stay away from it until the price goes above the resistance line at 1.1800 or below the support line at 1.1700.
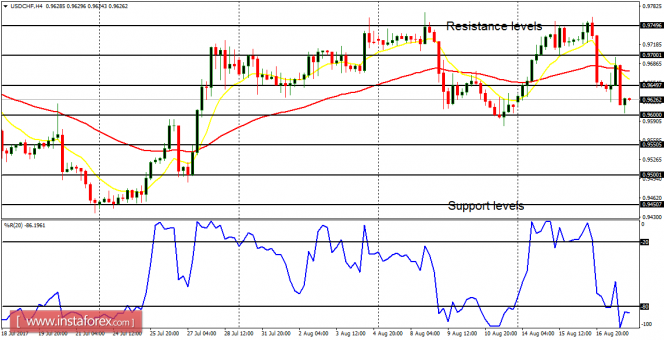
USD/CHF: This currency trading instrument went upward to test the resistance level at 0.9750 and then dropping below the resistance level at 0.9650. This has created a short-term bearish signal (the EMA 11 has crossed the EMA 56 to the downside, and the Williams' % Range period 20 is in the oversold territory); which means the support levels at 0.9600 and 0.9550 could be tested.
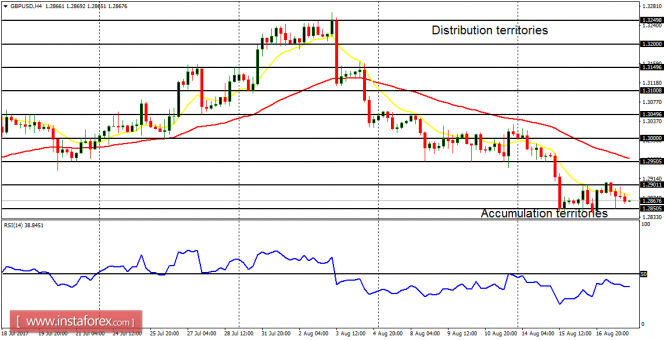
GBP/USD: This market went downwards, to test the accumulation territory at 1.2850, and then moving sideways till now. There is a Bearish Confirmation Pattern in the chart, and further downwards movement is expected, especially when the accumulation territory at 1.2850 is breached to the downside.
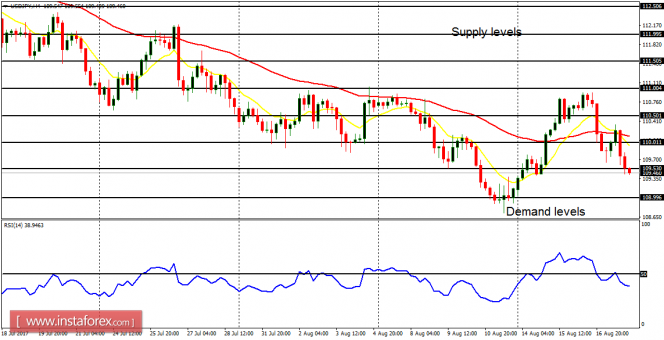
USD/JPY: The bearish signal on the USD/JPY has become clearer than it was yesterday. The EMA 11 is below the EMA 56, and the RSI period 14 is below the 50. Price is under the supply level at 109.50, and it may target the demand levels at 109.00 and 108.50 (which could be reached between today and next Monday).
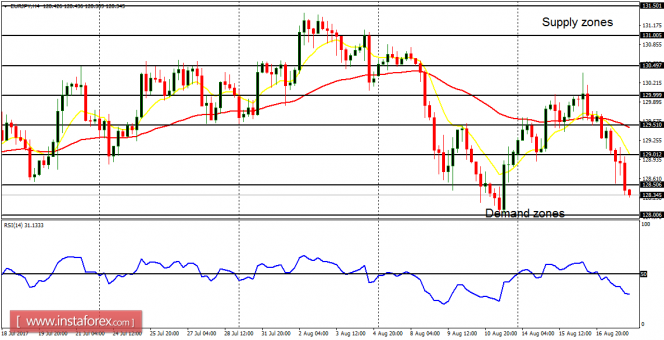
EUR/JPY: After generating a bearish signal, the EUR/JPY has gone down seriously. The price is now below the supply zone at 128.50, targeting the demand zone at 128.00. There is a Bearish Confirmation Pattern in the 4-hour chart, which points to further bearish journey.