
USD/JPY bulls are gaining momentum
As I promised on Monday, we move back to analyzing the technical picture for the dollar/yen pair. As you can already see in the title, we will focus on the technical component of this trading instrument. But before that, I would like to remind you that both currencies of this pair are considered safe-haven assets depending on the situation and market sentiments. In this regard, the dynamic of USD/JPY is of particular interest to me and is mostly associated with technical analysis, although this can be a rather controversial statement.
Daily chart
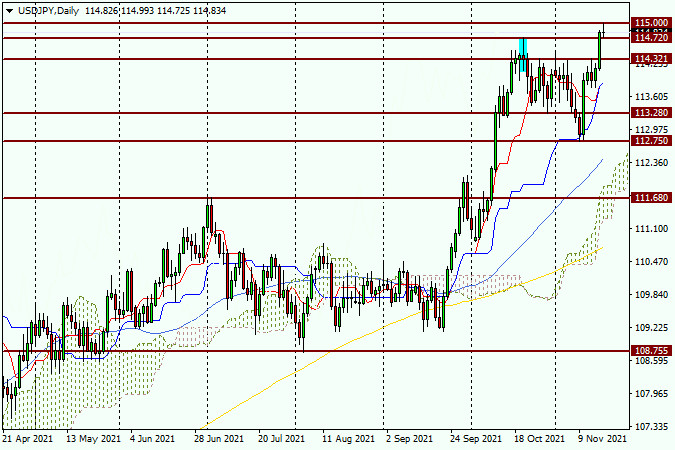
In the latest review of the currency pair, we discussed that the price consolidated in the range between 112.75 and 114.32. A breakout from this channel will help us determine the further direction of the price. At the same time, I noted that a valid breakout of the key resistance level of 114.72 will support the bullish sentiment on USD/JPY. After an impressive rise, the pair closed the session on November 16 at the level of 114.82, that is, 10 pips above the key resistance of the bears. However, it is too early to say that the USD/JPY bulls have regained control. It is not clear yet whether they will be able to advance to the strong psychological and technical area of 115.00-115.55.
I deliberately made the daily chart smaller so that it is clear that the pair is now trading in an uptrend, at least on the daily period. Once again, I would like to note the success of the pair bulls that managed to break through two strong resistance levels of 114.32 and 114.72 on November 16. At the same time, the blue 50-simple and orange 144-exponential moving averages, as well as the red Tenkan line and the blue Kijun line of the Ichimoku indicator, are confidently turning up or have already moved up following the price. This factor definitely confirms the bullish trend and contributes to further development of the uptrend. Today, the price has already rolled back to the resistance level of 114.72 which was broken through the day before. However, I consider it inappropriate to enter the market according to the daily chart. Therefore, let's discuss a shorter time frame.
H1
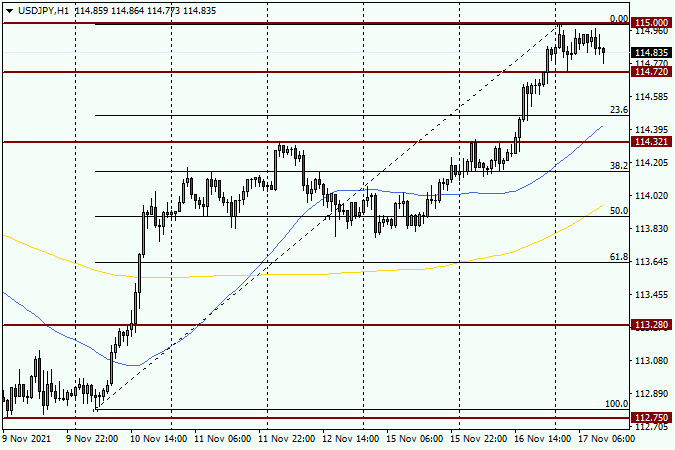
The important psychological and technical level of 115.00 clearly demonstrates its strength and significance. After missing just one pip to reach this significant mark, the pair faced very strong resistance from sellers and bounced to the downside, which was quite expected. There has already been a rollback to the resistance of 114.72, which was broken yesterday. Besides, the psychological level of 115.00 has not yet been broken through. So, at the time of writing, the USD/JPY pair was consolidating in this price range.
Despite yesterday's breakout of two strong resistance levels and the general bullish trend for the pair (starting from the daily chart), the situation for opening positions, in my opinion, is extremely uncertain. To open long positions, which are now seen as the main option for USD/JPY, I recommend waiting for a true breakout of the 115.00 level. We should consider opening buy trades following a pullback from this level. Another option for buyers will be a repeated pullback to the broken resistance level of 114.72. But here you should watch out for the Japanese candlesticks and their varieties. If a candlestick or a combination of reversal bearish candles appears on the daily or smaller time frames in the 115.00-115.55 area, this will be a signal that bulls are losing momentum and it is time for potential sales.
Wish you successful trading!
The material has been provided by InstaForex Company - www.instaforex.com