
Analysis of Tuesday's trades:
GBP/USD 30M Chart
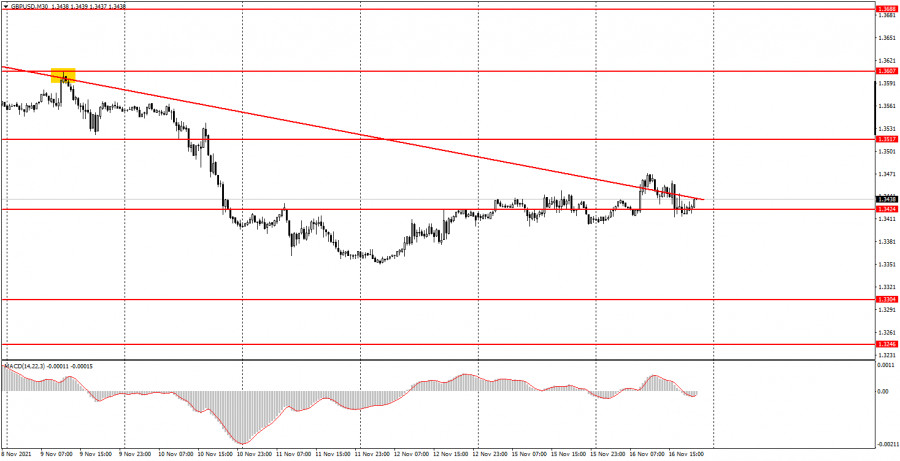
On Tuesday, November 16, GBP/USD continued the correction on the 30M time frame. However, the downward trend line is no longer valid, as the quotes broke above it. Still, it is not enough for the trend to reverse. During the European and American sessions, the pair was trading mixed. In early trades, the British pound was rising while later in the day, the US dollar took the lead. However, volatility was moderate with quotes fluctuating about 66 pips. As for macroeconomic statistics, markets saw some interesting releases. The first tick in the image below marks the moment when the UK unemployment and wages growth reports were published. These reports showed better-than-expected data which pushed the pound sterling higher. However, it failed to maintain the bullish bias. In the afternoon trades, the American dollar got boosted by the upbeat reports on industrial production and retail sales in the United States. These publications are marked with the second and third ticks in the chart.
GBP/USD 5M Chart
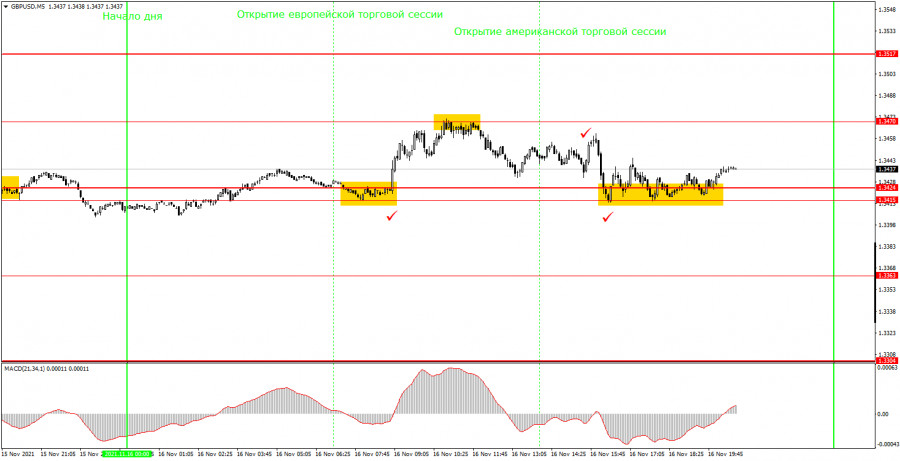
There were few trading signals in the 5M time frame on Tuesday. At least, the pair was moving, so these signals should have been used. The first buy signal was formed near 1.3415 – 1.3424. The pair rebounded from these levels after the publication of strong UK data, so it was the right moment for opening long trades. Later on, an ideal rebound from 1.3470 took place, so it was necessary to close buy deals and open sell ones. The long trades brought profits of 22 pips. After the sell signal had been formed, the pair moved down by 28 pips which were enough to set a stop loss profit. But then, the quotes started rising, so the stop-loss order was triggered. That is why my second trade was not profitable. The last third signal was formed near 1.3415 – 1.3424 as a rebound. Again, this signal served as a good buying opportunity. Still, it was not profitable, as the quotes barely moved. So, it was a bad day for trading. Still, it was better than nothing.
Trading plan for Wednesday, November 17:
At the moment of writing, the downward trend became invalid, though there has been neither a rebound nor a break. So, no signal has been formed. An upwards movement is more likely to continue, but for now, it remains weak. Obviously, bulls do not hurry to buy GBP/USD. In the 5M time frame, the key levels are 1.3304, 1.3363, 1.3415-1.3424, 1.3470, 1.3517. They can be used for trading on November 17. One should watch for a break or rebound from these levels. As usual, the take profit should be set 40-50 pips away from the price line. In the 5M time frame, the nearest levels can be used as targets. As soon as the quotes go 20 pips in the right direction, set a stop loss at a breakeven point. As for the upcoming statistics, the United Kingdom will unveil the CPI report for October which is going to be the key event of November 17. Experts anticipate the inflation rate to rise to 3.8% in annual terms. If the actual reading comes in lower or higher, it will surely fuel the market reaction and spark high volatility.
The basic principles of the trading system:
1) The strength of the signal depends on the time period during which the signal was formed (a rebound or a break)/ The shorter this period, the stronger the signal.
2) If two or more trades were opened at some level following false signals, i.e. those signals that did not lead the price to Take Profit level or the nearest target levels, then any consequent signals near this level should be ignored.
3) During the flat trend, any currency pair may form a lot of false signals or do not produce any signals at all. In any case, the flat trend is not the best condition for trading.
4) Trades are opened in the time period between the beginning of the European session and until the middle of the American one when all deals should be closed manually.
5) We can pay attention to the MACD signals in the 30M time frame only if there is good volatility and a definite trend confirmed by a trend line or a trend channel.
6) If two key levels are too close to each other (about 5-15 pips), then this is a support or resistance area.
How to read charts:
Support and Resistance price levels can serve as targets when buying or selling. You can place Take Profit levels near them.
Red lines are channels or trend lines that display the current trend and show which direction is better to trade.
MACD indicator (14,22,3) is a histogram and a signal line showing when it is better to enter the market when they cross. This indicator is better to be used in combination with trend channels or trend lines.
Important speeches and reports that are always reflected in the economic calendars can greatly influence the movement of a currency pair. Therefore, during such events, it is recommended to trade as carefully as possible or exit the market in order to avoid a sharp price reversal against the previous movement.
Beginning traders should remember that every trade cannot be profitable. The development of a reliable strategy and money management are the key to success in trading over a long period of time.
The material has been provided by InstaForex Company - www.instaforex.com