
Bitcoin plunged in the short term but it seems that it has reached a strong demand zone. BTC/USD dropped by 15.13% from the 69,000 all-time high to 58,563 today's low. Also, it has registered an 11.79% drop since 66,387.40 yesterday's high. Now it is traded at the 60,805 level far above today's low and right above the 60,000 psychological level.
The bias remains bullish despite the current sell-off. Maybe a temporary correction was natural after reaching a new fresh historical high of the 69,000 psychological level. BTC/USD dropped trying to accumulate more bullish energy and to attract more buyers before jumping higher again.
BTC/USD Pin Bar
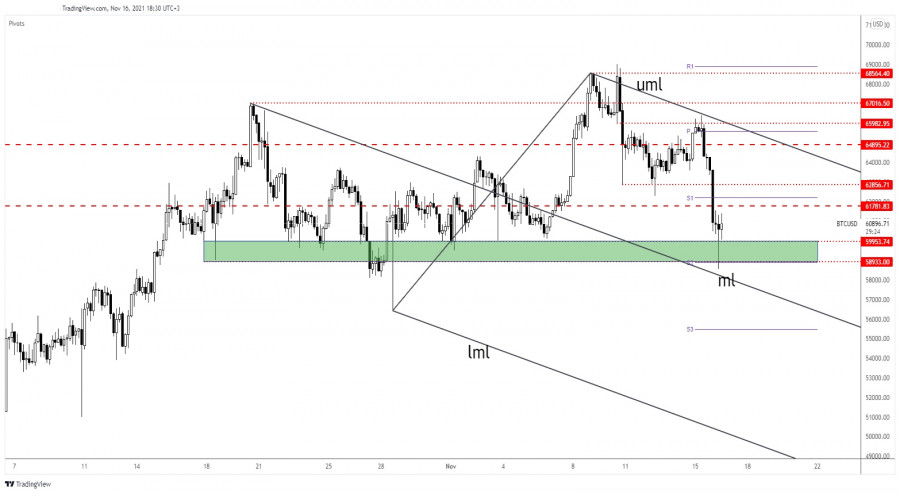
BTC/USD was under strong selling pressure after failing to stabilize above the weekly pivot point of 65,594.33 or to reach and retest the upper median line (uml). Technically, the price registered a false breakdown with great separation through the 59,953.74 - 58,933 support zone signaling that the downside movement could be over.
As you can see on the h4 chart, BTC/USD failed to reach the descending pitchfork's median line (ml) which is seen as a potential downside obstacle. When the rate fails to reach the median line, the rate could move in the opposite direction.
BTC/USD Outlook
Bitcoin printed a pin bar signaling strong demand right below the 60,000 psychological level. After its false breakdown with great separation below the support area, BTC/USD could start increasing again. Still, in the short term, it could move sideways before turning to the upside.
Personally, I believe that only a new lower low, a bearish closure under the 58,563 level could signal a larger downside movement.
The material has been provided by InstaForex Company - www.instaforex.com