
To open long positions on EURUSD, you need:
The eurozone data released in the first half of the day appealed to traders who managed to form a signal to buy the euro. Let's look at the 5-minute chart and figure out what happened. It is visible how the bears are trying to break 1.1362, but after a while, the bulls very quickly regain control of this level, which forms a signal to open long positions according to the scenario I described in detail in my forecast. The divergence, which continued to form after yesterday's low was updated, also benefited buyers. Until the moment when trading will be conducted above 1.1353, you can count on the recovery of the pair.
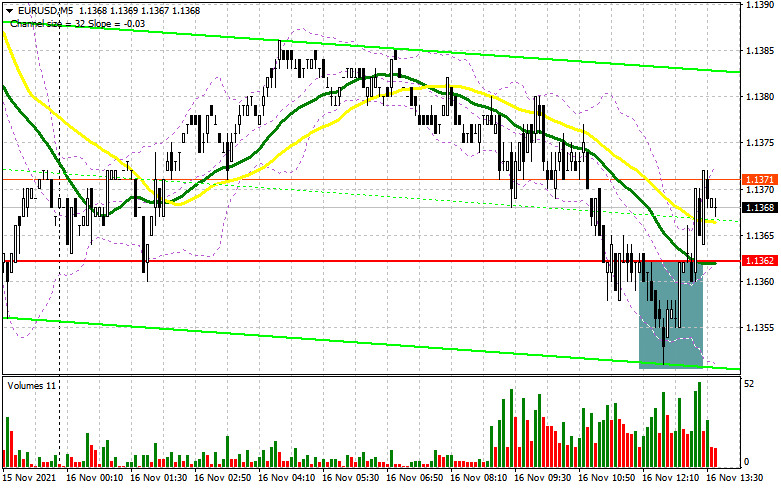
In the afternoon, we are expecting important data on changes in retail trade and changes in industrial production in the United States of America. If the indicators show a sharp slowdown against the background of high inflation, the pressure on the US dollar may increase. If not, the bears will try to take control of the market again. Therefore, only the return of the 1.1386 resistance by the bulls will stop the downward trend for the pair. The reverse test of 1.1386 from top to bottom after the publication of several reports will give an entry point to long positions based on the growth of EUR/USD in the area of 1.1421, where the moving averages are, which may limit the upward correction of the pair. A breakout of 1.1421 and a top-down test will lead to an additional buy signal and growth to the maximum of 1.1462, where I recommend fixing profits. A more distant target will be the 1.1514 area, but this is something out of a series of fiction - when all the representatives of the Fed suddenly start talking about an ultra-soft monetary policy today. In the case of a return of pressure on EUR/USD in the afternoon, only the formation of a false breakdown in the 1.1353 area will limit the fall and lead to the formation of a signal to open long positions by analogy with what I discussed above. In the absence of an activity scenario at 1.1353, it is best to wait for the formation of a false breakdown in the area of 1.1328, but it is possible to open long positions on EUR/USD immediately for a rebound from the minimum of 1.1304, counting on a correction of 15-20 points within a day.
To open short positions on EURUSD, you need:
Although the bears control the market, there are no people who want to sell at the current lows yet. Everyone is waiting for retail sales data, from which they will start. At the moment, bears need to keep in mind the protection of the 1.1386 level. The entire calculation in the afternoon will be based on a good volume of retail sales for October, which should exceed economists' forecasts and lead to the formation of a false breakdown at 1.1386. This forms the first signal to open short positions, which will give an excellent point to the market to reduce to a minimum of 1.1353. A breakdown and a test of this area from the bottom up will increase pressure on EUR/USD and lead to the demolition of several stop orders of buyers counting on a larger upward correction. This will open the way to new levels: 1.1328 and 1.1304. I recommend fixing profits on short positions there. Under the scenario of euro growth during the American session and the absence of bears at 1.1386, I advise you to postpone sales until the next resistance test - 1.1421. But even there, it is best to open short positions after the formation of a false breakdown. The best option for selling EUR/USD immediately on a rebound will be a maximum in the area of 1.1462. You can count on a downward correction of 15-20 points.
The COT report (Commitment of Traders) for November 9 recorded a reduction in short positions and a slight increase in long ones, which led to the return of a positive delta. The fact of high inflationary pressure in the US continues to support the US dollar, as many investors are counting on an earlier increase in interest rates by the Federal Reserve next year and are already winning back the market in this direction by buying the US dollar. The statements of representatives of the Central Bank, which have been heard recently, only confirm the expectations of market participants. At the same time, the president of the European Central Bank, Christine Lagarde, confidently insists that the ultra-soft monetary policy will not change even next year – this puts some pressure on buyers of risky assets who were counting on a more active recovery of the euro. In the near future, we will get acquainted with important data on retail sales in the United States and the unemployment rate in the eurozone, which will shed light on further actions by regulators to stimulate the economies of their countries. The latest November COT report indicated that long non-profit positions increased from the level of 191,496 to the level of 192,544, while short non-profit positions decreased from the level of 197,634 to the level of 188,771. At the end of the week, the total non-commercial net position became positive and amounted to 3,773 against -6,138. The weekly closing price decreased quite slightly, to the level of 1.1587 against 1.1599.
Signals of indicators:
Moving averages
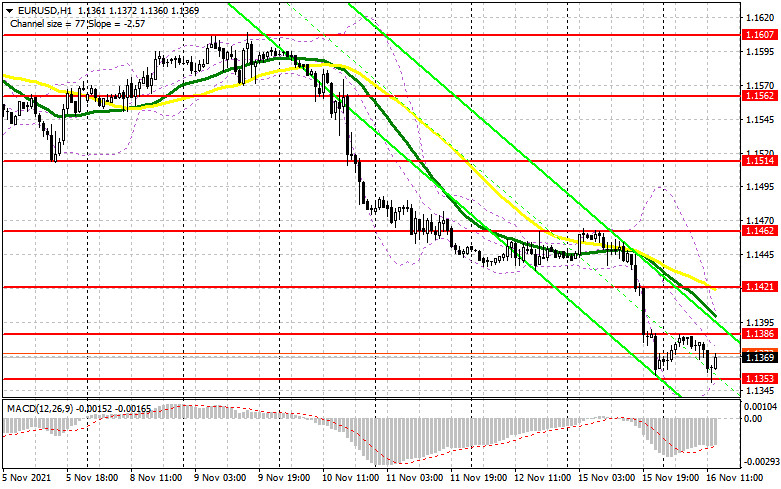
Trading is conducted below 30 and 50 daily moving averages, which indicates continued pressure on the market.
Note: The period and prices of moving averages are considered by the author on the hourly chart H1 and differ from the general definition of the classic daily moving averages on the daily chart D1.
Bollinger Bands
A breakthrough of the upper limit of the indicator in the area of 1.1405 will lead to a new wave of euro growth. A break of the lower limit of the indicator in the area of 1.1353 will increase the pressure on the pair.
Description of indicators
- Moving average (moving average determines the current trend by smoothing out volatility and noise). Period 50. The graph is marked in yellow.
- Moving average (moving average determines the current trend by smoothing out volatility and noise). Period 30. The graph is marked in green.
- MACD indicator (Moving Average Convergence / Divergence - moving average convergence/divergence) Fast EMA period 12. Slow EMA period 26. SMA period 9
- Bollinger Bands (Bollinger Bands). Period 20
- Non-profit speculative traders, such as individual traders, hedge funds, and large institutions that use the futures market for speculative purposes and meet certain requirements.
- Long non-commercial positions represent the total long open position of non-commercial traders.
- Short non-commercial positions represent the total short open position of non-commercial traders.
- Total non-commercial net position is the difference between the short and long positions of non-commercial traders.