
Analysis of previous deals:
30M chart of the EUR/USD pair
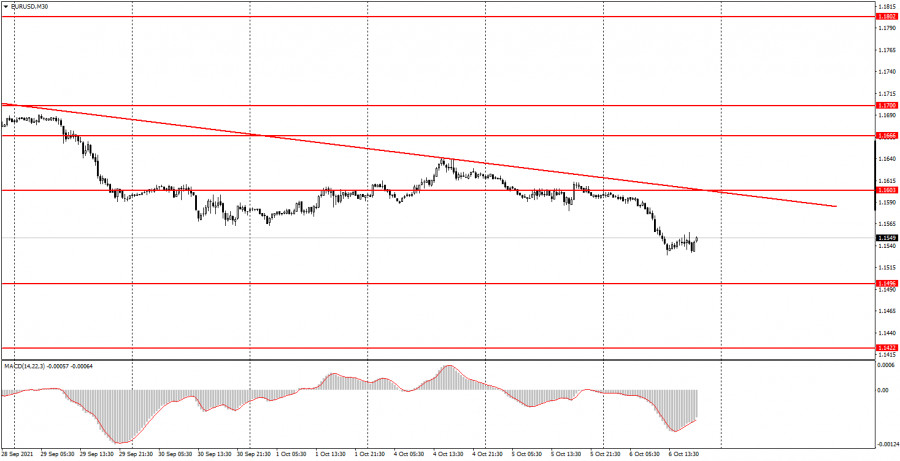
The EUR/USD pair continued downward movement during the day on Wednesday. The downtrend line has been slightly rebuilt, so at this time it is again relevant, therefore the downward trend continues. And if so, then formally now you can again track the signals from the MACD indicator to sell. Unfortunately, strong movements of the pair, or at least moderate-sized ones, are quite rare. Thus, for one day of good movement there are 3-4 extremely weak ones. And when volatility is low, the MACD indicator generates false signals. Therefore, a very contradictory situation turns out when the trend seems to be there, but at the same time the movements remain very weak and inconvenient for working out on the 30-minute timeframe. In any case, not a single signal from the MACD indicator was formed today. Also reports on retail sales in the eurozone and ADP in the United States were published during the day. They are marked with check marks in the charts below and, as you can see, there was no reaction to them, although the second report was quite important. Especially ahead of the release of NonFarm Payrolls data this Friday.
5M chart of the EUR/USD pair
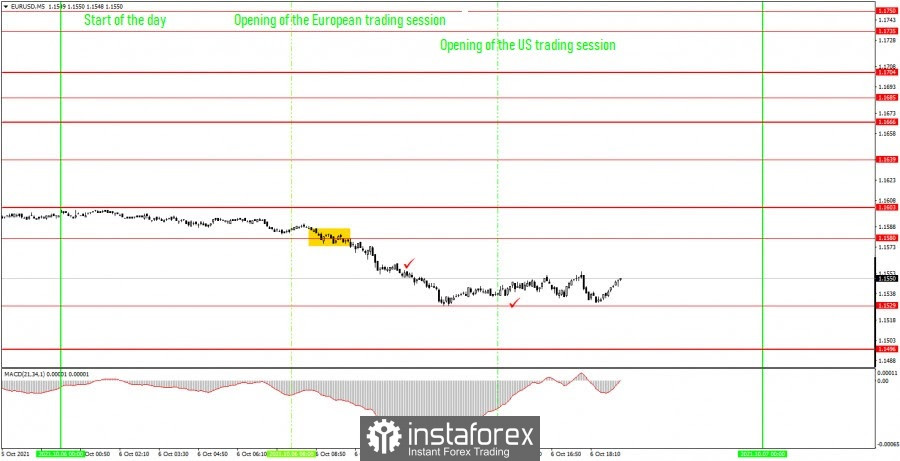
The technical picture on the 5-minute timeframe was almost perfect on Wednesday. First, there were no false signals. Secondly, only one sell signal was generated during the European trading session, and at the very beginning of the downward movement, a trend movement was observed throughout the session. Thus, novice traders had every reason to open short positions this morning on the signal to overcome the level of 1.1580, which is the previous day's low. After this signal, the price went down another 42 points, which was enough to trigger both the smallest Take Profit and the largest one. Therefore, beginners could earn from 30 to 40 points today. The 1.1529 level has not yet been hit during the day, as it is today's low. It should also be noted that the pair continues to move downward, which does not fit well with the current fundamental picture, and the markets completely ignore the macroeconomic data.
How to trade on Thursday:
The EUR/USD pair resumed its downward movement on the 30-minute timeframe, but it is still very weak. If we switch to a higher timeframe, we will see that this movement has been going on for more than a month, but at the same time the pair is decreasing by 20-25 points per day. And in most cases, the total volatility of the day does not exceed 40-50. Thus, it is still very inconvenient to trade on the 30-minute TF. The key levels on the 5-minute timeframe for October 7 are 1.1496, 1.1529, 1.1580, 1.1603, 1.1639, 1.1666. Take Profit, as before, is set at a distance of 30-40 points. Stop Loss - to breakeven when the price passes in the right direction by 15 points. At the 5M TF, the target can be the nearest level if it is not too close or too far away. If it is, then you should act according to the situation or work according to Take Profit. Neither the European Union nor the United States will have a single important macroeconomic report or other important event on Thursday. Novice traders will have nothing to pay attention to during tomorrow. Volatility may also be low again.
On the chart:
Support and Resistance Levels are the Levels that serve as targets when buying or selling the pair. You can place Take Profit near these levels.
Red lines are the channels or trend lines that display the current trend and show in which direction it is better to trade now.
The MACD indicator (14,22,3) consists of a histogram and a signal line. When they cross, this is a signal to enter the market. It is recommended to use this indicator in combination with trend lines (channels and trend lines).
Important speeches and reports (always contained in the news calendar) can greatly influence the movement of a currency pair. Therefore, during their exit, it is recommended to trade as carefully as possible or exit the market in order to avoid a sharp price reversal against the previous movement.
Beginners on Forex should remember that not every single trade has to be profitable. The development of a clear strategy and money management are the key to success in trading over a long period of time.
The material has been provided by InstaForex Company - www.instaforex.com