
GBP/USD 5M
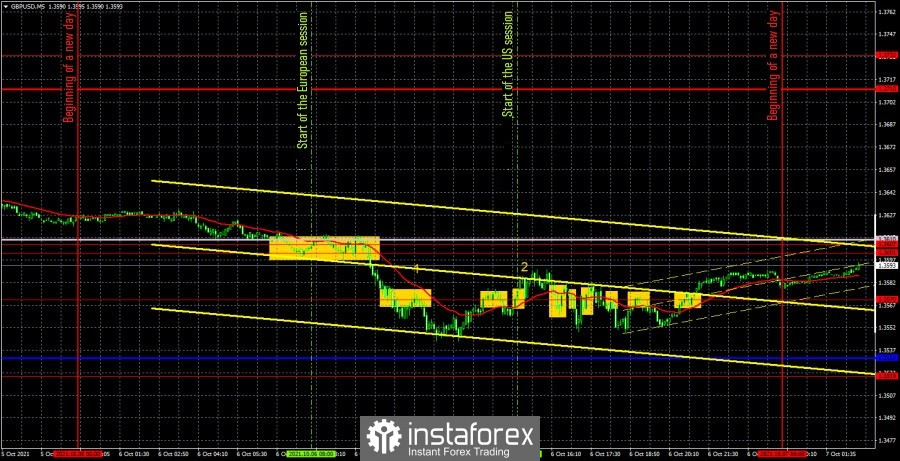
The GBP/USD pair was trading in a rather strange way on October 6. First, the markets ignored all the macroeconomic data of the day. And although there were few of them and it is impossible to call them too important, nevertheless, the pound/dollar pair first moved in a flat, then in a trend, and then in a swing. The number "1" represents the time when the report on business activity in the UK construction sector was published. The number "2" is when the ADP report in the United States was released. As you can see, we can only note a 10-point drop in the pair after the second report, which really turned out to be one and a half times higher than forecasted. However, 10 points is a movement that we may not even be a bit interested in. Even when the pair moves with low volatility, it passes at least 60-70 points per day. Therefore, 10 points are nothing. Now let's move on to trading signals, of which there were quite a few yesterday. The first signal was not strong and clear, but at the same time it turned out to be quite interesting in terms of working out. The price bounced off the Senkou Span B line, as well as from the levels 1.3601 and 1.3607, after which it began to fall, settled below the extreme level of 1.3570 and almost reached the critical line, but nevertheless turned up and returned to 1, 3570. Thus, traders could open around 1.3601 short positions, which should have been manually closed around the 1.3570 level. The profit on the deal was about 25 points. Then the pair formed a buy signal near the level of 1.3570, which turned out to be false, but traders could still work it out, although the ADP report was published around that time, so there was no need to risk it. By the time the next signal was formed (it's even difficult to say whether it was a buy or a sell), three false signals had already been formed near the level of 1.3570, after which the pair did not reach the nearest target level. Therefore, all subsequent signals could no longer be processed.
GBP/USD 1H
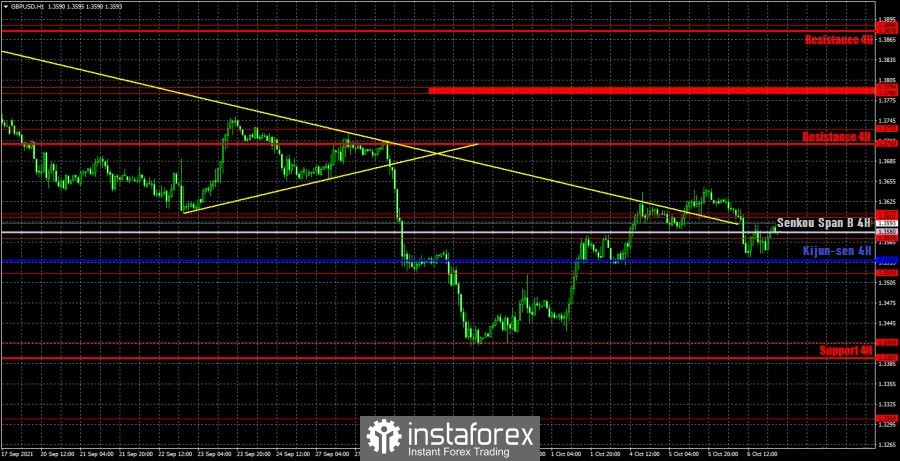
The pound/dollar pair continues its upward correction on the hourly timeframe, and broke the downward trend line yesterday. Thus, at the moment, it is concluded that the downward trend has been canceled, and the proximity of the Kijun-sen and Senkou Span B lines will help traders determine a new trend for the coming days. Consolidating above these two lines can provoke the continuation of the upward movement. The reverse closure under them is a new round of strengthening of the US currency. We distinguish the following important levels on October 7: 1.3519, 1.3570, 1.3601 - 1.3607, 1.3732. Senkou Span B (1.3580) and Kijun-sen (1.3538) lines can also be sources of signals. It is recommended to set the Stop Loss level at breakeven when the price passes 20 points in the right direction. The Ichimoku indicator lines can move during the day, which should be taken into account when looking for trading signals. There will be no major report or event on Thursday in the UK. It's the same in the United States. Thus, traders will be drawn to Friday's most important reports on the US labor market, unemployment rate and wages. At the moment, the trend for the pound/dollar pair is ambiguous, so the last two trading days of the week can help determine the further direction. Let us also recall that the fundamental background is now also rather ambiguous for the dollar and the pound.
We also recommend that you familiarize yourself with the forecast and trading signals for the EUR/USD pair.
COT report
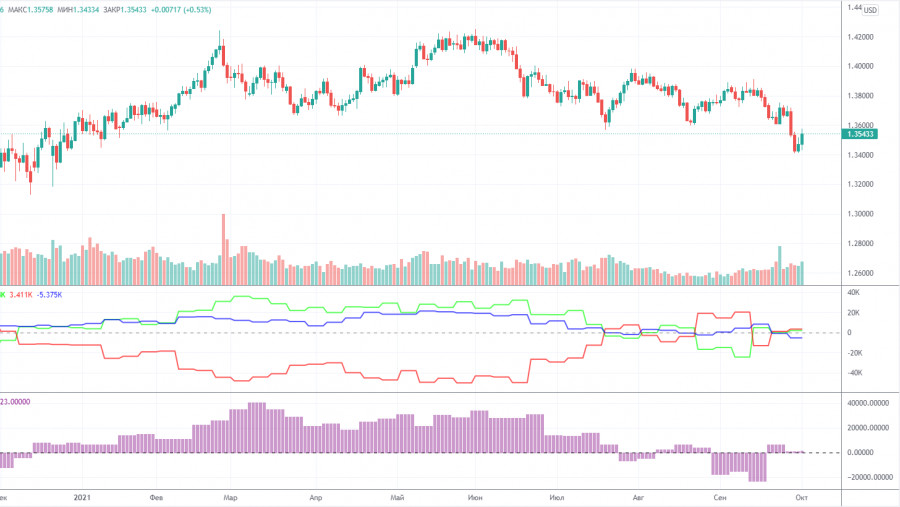
Major players slightly strengthened their bullish mood during the last reporting week (September 21-27). Although it is now as neutral as possible in fact. The fact is that the value of the net position for the non-commercial group of traders is now around zero, which means equality between the number of open long and short positions in the pound. Consequently, neither bulls nor bears have the initiative. Moreover, in the last couple of months, the mood of professional traders has been constantly changing, as the net position is either increasing or decreasing. Thus, from our point of view, the conclusion is obvious: the COT reports do not indicate either bullish or bearish sentiment now. Changes in the non-commercial group were minimal. 5.5 thousand buy contracts (longs) and 4.5 thousand sell contracts (shorts) were opened during the reporting week. Thus, the net position of non-commercial traders increased by 1,000. If in the case of the European currency, the COT reports signal a very likely further fall, then in the case of the pound, the COT reports just indicate the neutral mood of traders. The picture above shows a clear downward trend, but the problem is that professional players do not continue selling the British currency. Consequently, further decline is not evident for the pound. Take note that the euro corrected by about 43% against the upward trend, and the pound - by 24%.
Explanations for the chart:
Support and Resistance Levels are the levels that serve as targets when buying or selling the pair. You can place Take Profit near these levels.
Kijun-sen and Senkou Span B lines are lines of the Ichimoku indicator transferred to the hourly timeframe from the 4-hour one.
Support and resistance areas are areas from which the price has repeatedly rebounded off.
Yellow lines are trend lines, trend channels and any other technical patterns.
Indicator 1 on the COT charts is the size of the net position of each category of traders.
Indicator 2 on the COT charts is the size of the net position for the non-commercial group.
The material has been provided by InstaForex Company - www.instaforex.com