
GBP/USD 5M
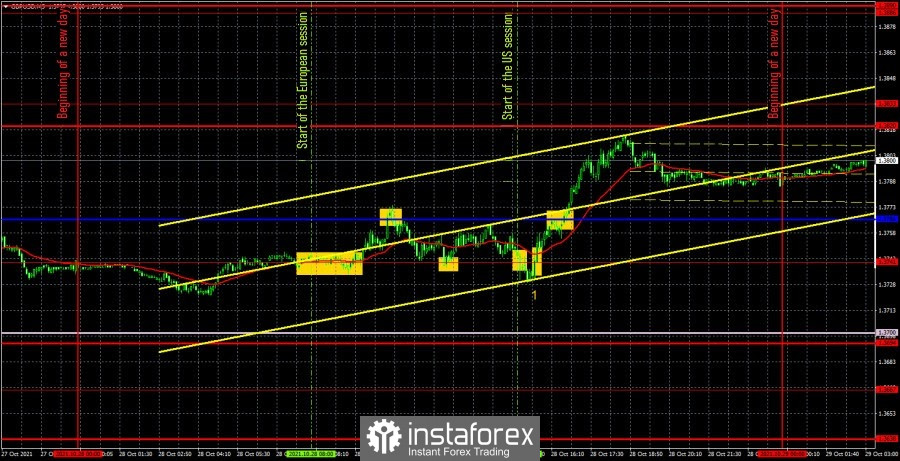
The GBP/USD pair was trading very, very well on October 28. Of course, such a strong movement was provoked by the only important event of the day for the pound/dollar pair - the report on US GDP for the third quarter. As a reminder, the report failed, and GDP growth was only 2.0% q/q. Thus, the disappointment of traders can be understood, as well as the sell-off of the dollar. There was no major news in the UK during the day. Therefore, let's start analyzing trading signals. In the first half of the day, the pair was mainly between the extremum level of 1.3741 and the Kijun-sen line. There was a distance of 25 points between them, so it was possible to reject signals. A buy signal was formed first, when the price did not bounce too accurately from the level of 1.3741. A long position should have been closed near the critical line, as a rebound followed from it. The result is 10 points of profit. One should have opened short positions on the signal of a rebound from the Kijun-sen line, while the price dropped back to the level of 1.3741, where they should have been closed. Another 10 points. A new rebound from the level of 1.3741 - new longs on the pair, but this time the price failed to reach the Kijun-sen, so the deal closed at a loss by closing below the level of 1.3741. Loss of 10 points. Almost immediately, the price consolidated back above the level of 1.3741 and began a strong growth, which was triggered by the report on GDP in the United States (the number "1" in the chart). Therefore, at the signal to sell, one should not open positions, and the signal to buy could be worked out, since by the time of its formation it had already become clear that the dollar could only fall after such a report. Consequently, a long position was entered at around 1.3752. The price subsequently crossed the critical line, so it was necessary to stay in the longs. And in the late afternoon, it was possible to manually close long positions, since the price did not manage to reach the nearest resistance level of 1.3820 by that time, and we cannot postpone the deal the next day. The profit was 50 points. Thus, we managed to earn about 60 points in total.
GBP/USD 1H
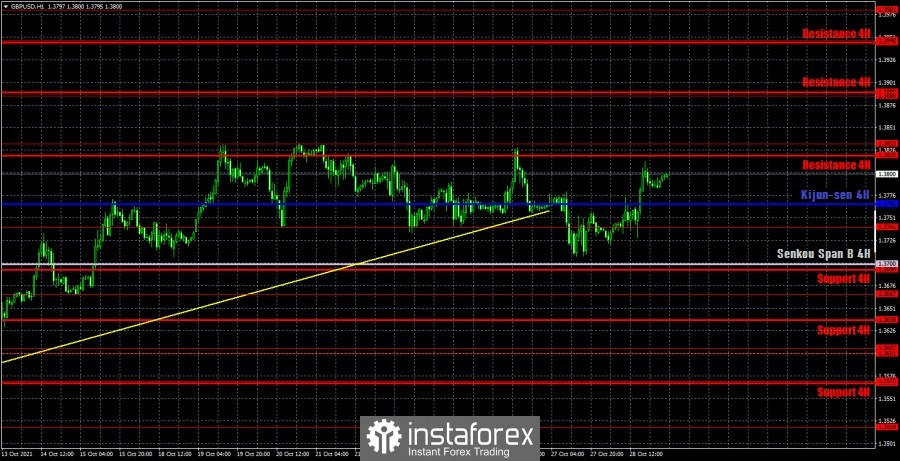
The pound/dollar pair has settled below the upward trend on the hourly timeframe, but, thanks to weak statistics from the United States, it has a chance for the upward trend to resume. So far, the price is again above the Kijun-sen and Senkou Span B lines, so the trend is considered rising. However, it will be necessary to see in the next couple of days whether yesterday's movement was not an accident. On October 29, we highlight the following important levels: 1.3741, 1.3833, 1.3886. Senkou Span B (1.3700) and Kijun-sen (1.3766) lines can also be signal sources. It is recommended to set the Stop Loss level at breakeven when the price passes 20 points in the right direction. The Ichimoku indicator lines can move during the day, which should be taken into account when looking for trading signals. The UK is still an empty calendar of macroeconomic and fundamental events on Friday. Thus, traders will be focused on secondary statistics from overseas. This will be a good opportunity to find out if yesterday's strong move was a coincidence. Because with such statistics, one should hardly expect high volatility of the pair.
We recommend you to familiarize yourself:
Overview of the EUR/USD pair. October 29. Christine Lagarde: Inflation will continue to be high
Overview of the GBP/USD pair. October 29. The US GDP report led to the fall of the dollar. Great Britain collects a collection of problems and crises
Forecast and trading signals for EUR/USD for October 29. Detailed analysis of the movement of the pair and trade deals.
COT report
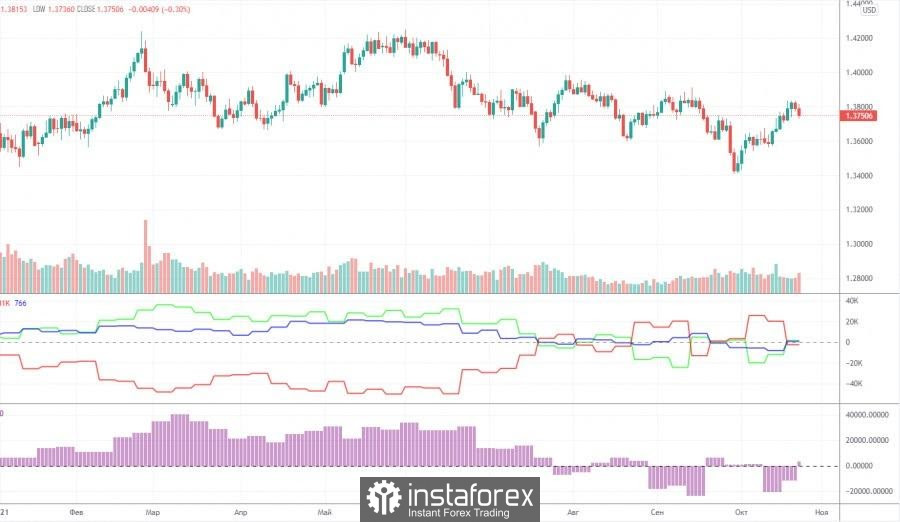
The mood of professional traders became less bearish again during the last reporting week (October 12-18). The situation with the Commitment of Traders (COT) reports is now even more ambiguous than with the technical picture. And if we compare the COT reports for the euro and the pound, then the situation becomes even stranger. Both indicators in the chart above show that large players do not have any clear, precise and understandable mood at the moment. Consequently, now it is simply impossible to make any forecasts based on COT reports. In principle, the chart above clearly shows the entire movement of the pair over the past year. It is rather difficult to call it a trend or even a trend. In the last couple of months, the mood of the big players has been constantly changing. The green and red lines of the first indicator (net positions of groups of traders "commercial" and "non-commercial") are constantly changing the direction of movement. This means that the two largest groups of traders are constantly increasing and decreasing their net positions. During the reporting week, professional traders opened 2,000 buy contracts (longs) and closed 12.5 thousand sell contracts (shorts). Thus, their net position increased by 10.5 thousand contracts. This is in line with what has been happening with the pound in recent weeks (it is rising). Nevertheless, it is impossible to make a long-term forecast, since the net position may fall already by the end of next week. We also pay attention to the fact that the green and red lines of the first indicator are not moving towards each other and are not moving away from each other. Therefore, it is also impossible to talk about any trend now.
Explanations for the chart:
Support and Resistance Levels are the levels that serve as targets when buying or selling the pair. You can place Take Profit near these levels.
Kijun-sen and Senkou Span B lines are lines of the Ichimoku indicator transferred to the hourly timeframe from the 4-hour one.
Support and resistance areas are areas from which the price has repeatedly rebounded off.
Yellow lines are trend lines, trend channels and any other technical patterns.
Indicator 1 on the COT charts is the size of the net position of each category of traders.
Indicator 2 on the COT charts is the size of the net position for the non-commercial group.
The material has been provided by InstaForex Company - www.instaforex.com