
EUR/USD 5M
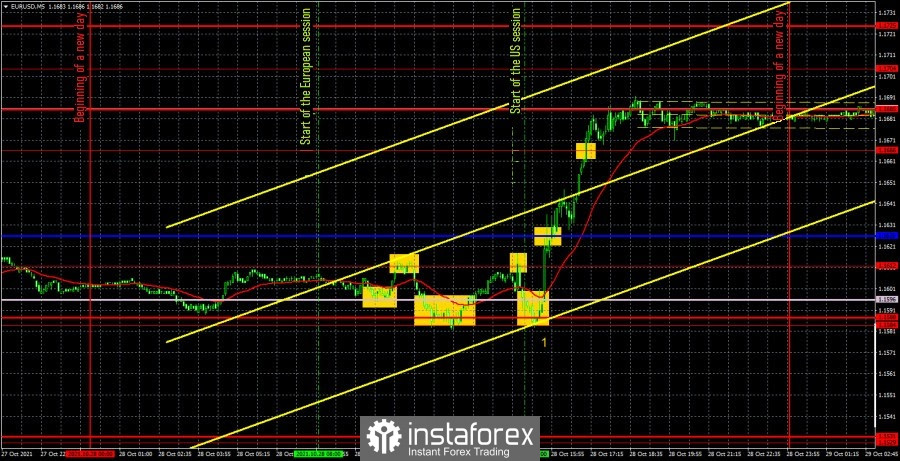
The EUR/USD pair made an impressive 100 points gain during the penultimate trading day of the week. There is nothing surprising about this, since the European Central Bank met on that day, its results were announced, as well as a press conference with ECB President Christine Lagarde. In addition, an important report on US GDP was published, which also turned out to be very impressive. And all these events took place at approximately the same time - at the beginning of the US trading session. Therefore, it was at this time that a strong movement began. This movement was only in one direction - up. And this is also not surprising. The ECB meeting could well be considered a passing one, but Lagarde said that the asset purchase program will continue to decline in the fourth quarter, which could have provoked purchases of the euro. In addition, the report on US GDP in the third quarter frankly failed, as after growth by 6.7% in the second quarter and with a forecast of + 2.6% in the third, the actual value was only 2.0%. Thus, both of these events multiplied each other, which is why we saw a strong movement that was absolutely unusual for the euro/dollar pair in recent months. Now all that remains is to deal with the trading signals, of which there were quite a few on Thursday. The pair spent the first half of the day in absolutely calm trading. The price alternately reached the level of 1.1612 and the Senkou Span B line (1.1596). In the last review, we said that when key levels are so close to each other, they should be considered together. In principle, only rebounds from the support level of 1.1584 could be worked out, but they were also in close proximity to other important levels and lines. Thus, the overall picture of the state of affairs becomes even more complicated. All signals near the levels 1.1584, 1.1588, 1.1612 and the Senkou Span B line should be ignored, and trade should be started only when the GDP report was published and the results of the ECB meeting were summed up. At this time, the price settled above the critical line, so long positions should have been opened. Subsequently, the level of 1.1666 was easily overcome and the resistance level of 1.1685 was reached. Long positions should have been closed around this level. The profit was about 44 points.
EUR/USD 1H
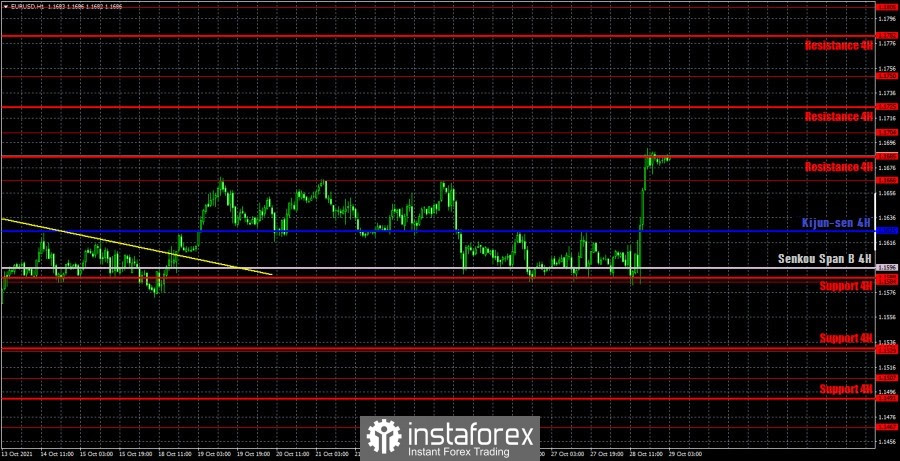
You can also clearly see that the price tried to settle below the level of 1.1584 on the hourly timeframe for several days, but it failed. However, it should be noted that yesterday's upward movement was triggered by strong reports and foundation, so today volatility may bounce back and again not exceed 40-50 points. Also, no conclusions can be drawn on the formation of a new trend. We highlight the following levels for trading on Friday - 1.1584, 1.1666, 1.1704, 1.1750, as well as the Senkou Span B (1.1596) and Kijun-sen (1.1625) lines. The Ichimoku indicator lines can change their position during the day, which should be taken into account when looking for trading signals. Signals can be rebounds or breakthroughs of these levels and lines. Do not forget about placing a Stop Loss order at breakeven if the price moves 15 points in the right direction. This will protect you against possible losses if the signal turns out to be false. The European Union will also publish a rather important report on October 29 - on inflation for October. Markets expect it to accelerate to 3.7% y/y and if the forecast comes true or is exceeded, Lagarde's words about high inflation will be confirmed. Thus, any excess of the forecast could provide additional support for the European currency, as it will bring the ECB closer to winding down PEPP on time. Only minor reports will be published in America.
We recommend you to familiarize yourself:
Overview of the EUR/USD pair. October 29. Christine Lagarde: Inflation will continue to be high
Overview of the GBP/USD pair. October 29. The US GDP report led to the fall of the dollar. Great Britain collects a collection of problems and crises
Forecast and trading signals for GBP/USD for October 29. Detailed analysis of the movement of the pair and trade deals.
Analysis of the COT report
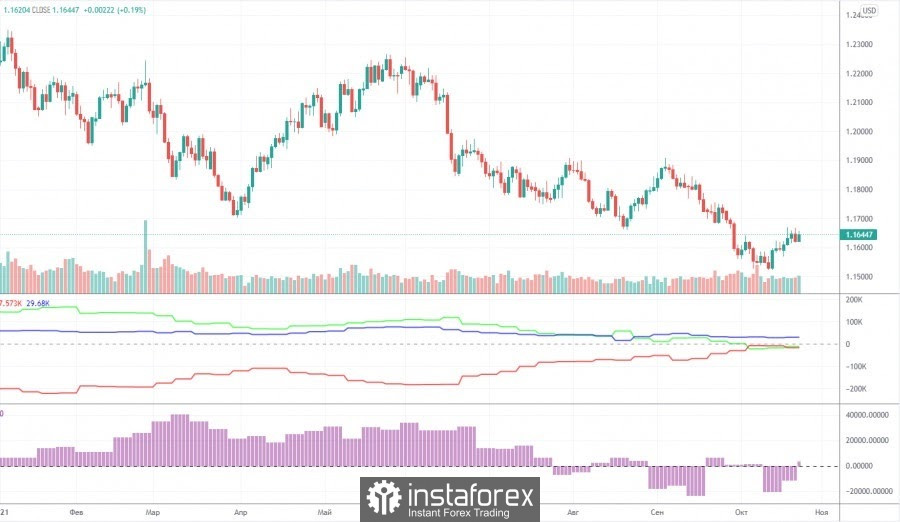
The mood of non-commercial traders changed into a bullish direction during the last reporting week (October 12-18). During the reporting week, 8,500 buy contracts (longs) and 16,000 sales contracts (shorts) were closed. Thus, the net position of the "non-commercial traders" group, which is the most important group, increased by 7.5 thousand. And here it is just right to talk about the "disease of the British pound." Let us remind you that the net position of professional pound players has been jumping up and down over the past few months. And this, in turn, indicates that there is no single mood and clear trend. We are seeing the same thing now in the euro currency. This is eloquently signaled by the second indicator, which shows either an increase in the net position or a decrease. Consequently, at this time, major players do not understand what to do next with the euro currency. Also, in the chart above, you can see that the pair rate went only 100 points below the previous local low. Therefore, at this time, the entire technical picture of the long-term plan still looks like a standard three-wave correction. Therefore, from our point of view, the formation of a new upward trend in the near future is still very likely, given the attempts with which the European currency has been falling over the past 8-9 months. But at the same time, we remind you that while there are no buy signals, you should not rush to the market with long positions. Any fundamental hypothesis requires specific technical confirmation. If they are not there, then you should not make the appropriate trading decisions.
Explanations for the chart:
Support and Resistance Levels are the levels that serve as targets when buying or selling the pair. You can place Take Profit near these levels.
Kijun-sen and Senkou Span B lines are lines of the Ichimoku indicator transferred to the hourly timeframe from the 4-hour one.
Support and resistance areas are areas from which the price has repeatedly rebounded off.
Yellow lines are trend lines, trend channels and any other technical patterns.
Indicator 1 on the COT charts is the size of the net position of each category of traders.
Indicator 2 on the COT charts is the size of the net position for the non-commercial group.
The material has been provided by InstaForex Company - www.instaforex.com