While Bitcoin is stabilizing near the growth zone, the second leader of the cryptocurrency market updated the historical maximum early on October 29, reaching $4.4k. The absolute record of altcoin was achieved against the background of a successful update that launched the phase of merging versions 1.0 and 2.0., as well as a sharp increase in on-chain activity. The combination of these factors allowed Ethereum to reach $4.4k at the moment, after which the price decreased slightly, and as of 11:30 UTC, the asset is trading around $4.3k. The coin retains positions favorable for growth, and therefore it is necessary to conduct a technical analysis of ETH/USD to determine whether the coin is able to continue the upward movement and rewrite the historical record again.
Over the past day, altcoin has risen in price by 4% with daily trading volumes in the region of $30 billion, which is an average indicator and indicates a temporary decline in activity in the asset network. At the same time, the ether retains the positive dynamics of price movement and in a two-hour section, quotes increased by 1%. This indirectly confirms the desire of investors to continue the bullish rally.
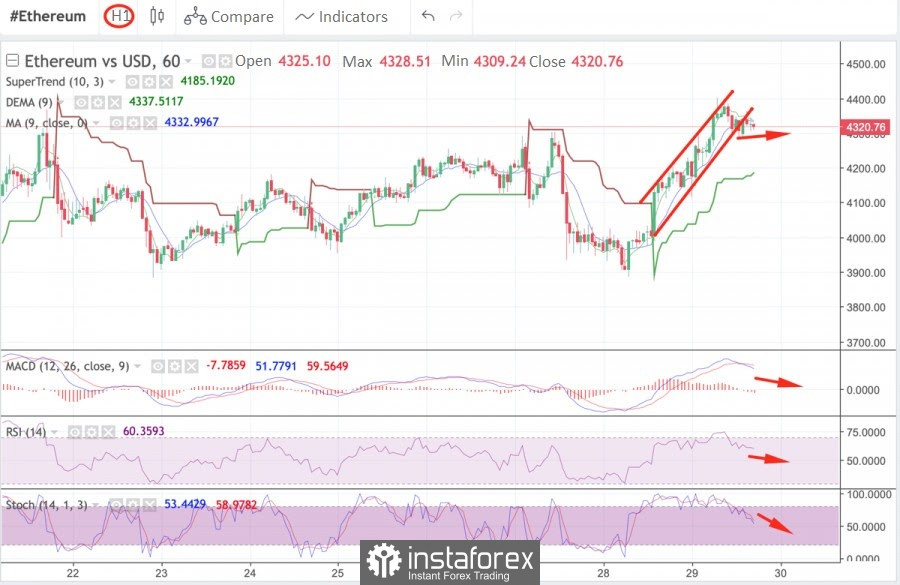
However, the technical indicators on the hourly chart are beginning to decline, and there are prerequisites for the price to test the strength of the support zone at $4.2k. This is evidenced by the bearish breakdown of the "bullish flag" technical analysis figure after setting a new record, which is a sign of a local decline and weakening of the short-term upward trend.
The main indicators also began to signal a decline, although it is worth noting that the starting point was the overbought zone, and therefore this process should be considered as stabilization. The MACD has formed a bearish intersection and is starting to decline beyond the zero mark, and the stochastic is falling beyond the 40 mark, which indicates an increase in pressure on the price. The relative strength index is also acquiring a downward trajectory, but it is still holding above 50.
*Learn and analyze
On-chain activity is the actions of cryptocurrency market players who independently manage their crypto assets, which is why the recording goes directly to the main blockchain. These statistics include both private investors and large companies. Price consolidation is the period when a certain cryptocurrency is within a narrow horizontal price channel. Usually, this process indicates price stabilization or weakness of market participants (buyers and sellers).
Relative Strength Index (RSI) is a technical indicator that allows you to determine the strength of a trend (downward or upward), warns of possible changes in the direction of price movement. Thanks to this metric, it is possible to determine in what stage the asset is - overbought or underbought. The optimal mark for this chart is 60 for a bullish trend. It indicates strong demand for the coin and the strength of the current upward momentum. Upon crossing this mark, the coin begins to move towards overbought.
MACD (Moving Average Convergence / Divergence Index) is an indicator that allows you to draw certain conclusions about the trend based on the movement of moving averages and finding the metric values between them. A common bullish signal is the intersection of the white line below the red and bearish, on the contrary, when the white line crosses the red from above, which indicates a downward movement.
Stochastic (Stochastic Oscillator) indicates the strength of the momentum of the current prevailing trend. If the indicator is above 80, then the asset can be considered overbought, but if the stochastic is below 20, then this is a signal that the asset is oversold.
Supertrend line is a technical indicator that reflects a bullish (green - a buy signal) and bearish (red - a sell signal) trend on the horizontal charts of a cryptocurrency.
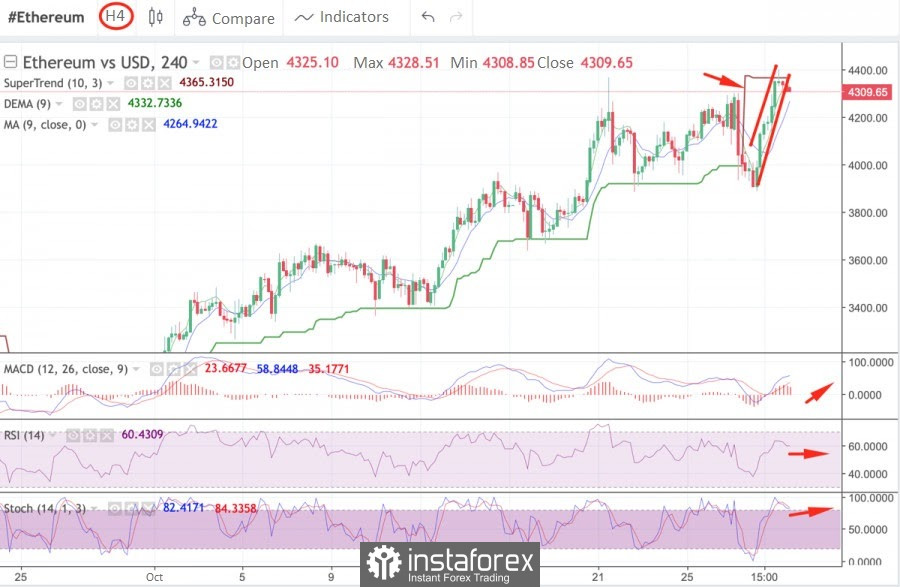
On the four-hour chart, the price is still holding below the supertrend line, despite breaking the historical record. At the same time, the situation begins to stabilize and major indicators move sideways or signal an attempt to realize a bullish impulse. For example, the MACD has passed the red zone and started to grow, and the stochastic oscillator is close to forming a bullish intersection, which indicates a local upward momentum. However, the relative strength index continues to fall and will soon break through the 50 mark, which indicates that there is no opportunity to develop an upward movement in the medium term due to the lack of growth in buyer activity. Summing up the results of the interim analysis of narrow timeframes, the bullish strength of the short-term upward trend has almost dried up.
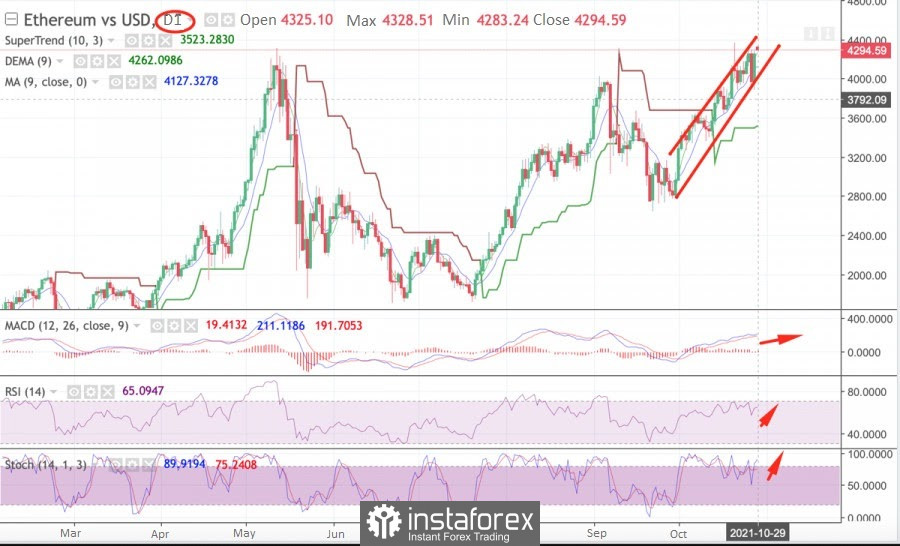
On the daily chart, the situation acquires a clear bullish color: according to the results of the previous trading day, the coin formed a bullish engulfing candle, and the price is confidently holding above the supertrend line, which indicates a positive market mood. At the same time, technical indicators continue to indicate a further increase in quotes, which is why a divergence is formed between the market price and technical indicators.
At the moment, Ether sank to $4.3k, while the MACD continues its upward movement, indicating the strength of the medium-term momentum. The stochastic oscillator has crossed the safe zone and is approaching the 80 mark, which indicates that the asset is overbought in the daily range. The relative strength index remains within the safe zone, but will also enter the overbought corridor soon.
With all this in mind, the probability of a local correction and a test of the strength of support zones in the region of $4.2k, $4k, and $3.8k is growing. These are the most likely points of rebound to the growth range followed by a period of stabilization and recovery. Therefore, betting on longs and setting a new historical record in the next day or two is risky.